- South Korea
- /
- Pharma
- /
- KOSE:A017180
MYUNGMOON Pharm co.,Ltd's (KRX:017180) 35% Share Price Surge Not Quite Adding Up


MYUNGMOON Pharm co.,Ltd (KRX:017180) shares have had a really impressive month, gaining 35% after a shaky period beforehand. Looking further back, the 17% rise over the last twelve months isn't too bad notwithstanding the strength over the last 30 days.
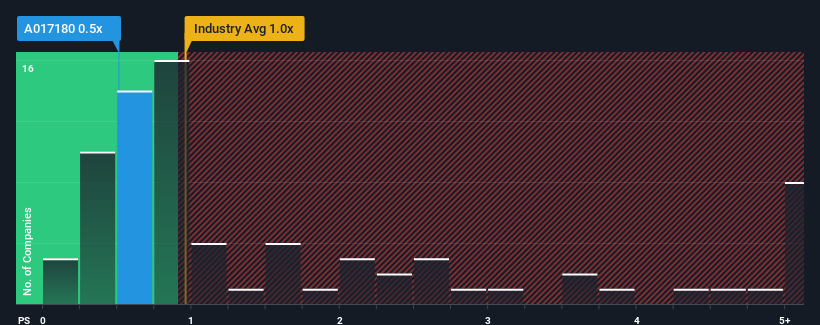
Although its price has surged higher, you could still be forgiven for feeling indifferent about MYUNGMOON PharmLtd's P/S ratio of 0.5x, since the median price-to-sales (or "P/S") ratio for the Pharmaceuticals industry in Korea is also close to 1x. Although, it's not wise to simply ignore the P/S without explanation as investors may be disregarding a distinct opportunity or a costly mistake.
See our latest analysis for MYUNGMOON PharmLtd
What Does MYUNGMOON PharmLtd's P/S Mean For Shareholders?
MYUNGMOON PharmLtd has been doing a good job lately as it's been growing revenue at a solid pace. Perhaps the market is expecting future revenue performance to only keep up with the broader industry, which has keeping the P/S in line with expectations. If you like the company, you'd be hoping this isn't the case so that you could potentially pick up some stock while it's not quite in favour.
We don't have analyst forecasts, but you can see how recent trends are setting up the company for the future by checking out our free report on MYUNGMOON PharmLtd's earnings, revenue and cash flow.How Is MYUNGMOON PharmLtd's Revenue Growth Trending?
There's an inherent assumption that a company should be matching the industry for P/S ratios like MYUNGMOON PharmLtd's to be considered reasonable.
Retrospectively, the last year delivered a decent 10% gain to the company's revenues. This was backed up an excellent period prior to see revenue up by 38% in total over the last three years. Therefore, it's fair to say the revenue growth recently has been superb for the company.
This is in contrast to the rest of the industry, which is expected to grow by 60% over the next year, materially higher than the company's recent medium-term annualised growth rates.
In light of this, it's curious that MYUNGMOON PharmLtd's P/S sits in line with the majority of other companies. Apparently many investors in the company are less bearish than recent times would indicate and aren't willing to let go of their stock right now. They may be setting themselves up for future disappointment if the P/S falls to levels more in line with recent growth rates.
The Key Takeaway
MYUNGMOON PharmLtd's stock has a lot of momentum behind it lately, which has brought its P/S level with the rest of the industry. Typically, we'd caution against reading too much into price-to-sales ratios when settling on investment decisions, though it can reveal plenty about what other market participants think about the company.
Our examination of MYUNGMOON PharmLtd revealed its poor three-year revenue trends aren't resulting in a lower P/S as per our expectations, given they look worse than current industry outlook. When we see weak revenue with slower than industry growth, we suspect the share price is at risk of declining, bringing the P/S back in line with expectations. Unless there is a significant improvement in the company's medium-term performance, it will be difficult to prevent the P/S ratio from declining to a more reasonable level.
You should always think about risks. Case in point, we've spotted 2 warning signs for MYUNGMOON PharmLtd you should be aware of, and 1 of them can't be ignored.
If strong companies turning a profit tickle your fancy, then you'll want to check out this free list of interesting companies that trade on a low P/E (but have proven they can grow earnings).
If you're looking to trade MYUNGMOON PharmLtd, open an account with the lowest-cost platform trusted by professionals, Interactive Brokers.
With clients in over 200 countries and territories, and access to 160 markets, IBKR lets you trade stocks, options, futures, forex, bonds and funds from a single integrated account.
Enjoy no hidden fees, no account minimums, and FX conversion rates as low as 0.03%, far better than what most brokers offer.
Sponsored ContentNew: Manage All Your Stock Portfolios in One Place
We've created the ultimate portfolio companion for stock investors, and it's free.
• Connect an unlimited number of Portfolios and see your total in one currency
• Be alerted to new Warning Signs or Risks via email or mobile
• Track the Fair Value of your stocks
Have feedback on this article? Concerned about the content? Get in touch with us directly. Alternatively, email editorial-team (at) simplywallst.com.
This article by Simply Wall St is general in nature. We provide commentary based on historical data and analyst forecasts only using an unbiased methodology and our articles are not intended to be financial advice. It does not constitute a recommendation to buy or sell any stock, and does not take account of your objectives, or your financial situation. We aim to bring you long-term focused analysis driven by fundamental data. Note that our analysis may not factor in the latest price-sensitive company announcements or qualitative material. Simply Wall St has no position in any stocks mentioned.
Have feedback on this article? Concerned about the content? Get in touch with us directly. Alternatively, email editorial-team@simplywallst.com
About KOSE:A017180
MYUNGMOON PharmLtd
Engages in the research, development, production, distribution, and sale of pharmaceuticals in South Korea and internationally.
Mediocre balance sheet and slightly overvalued.
Market Insights

Community Narratives


