

David Iben put it well when he said, 'Volatility is not a risk we care about. What we care about is avoiding the permanent loss of capital.' So it seems the smart money knows that debt - which is usually involved in bankruptcies - is a very important factor, when you assess how risky a company is. Importantly, SillaJen, Inc. (KOSDAQ:215600) does carry debt. But is this debt a concern to shareholders?
When Is Debt Dangerous?
Debt is a tool to help businesses grow, but if a business is incapable of paying off its lenders, then it exists at their mercy. If things get really bad, the lenders can take control of the business. However, a more common (but still painful) scenario is that it has to raise new equity capital at a low price, thus permanently diluting shareholders. Having said that, the most common situation is where a company manages its debt reasonably well - and to its own advantage. When we examine debt levels, we first consider both cash and debt levels, together.
See our latest analysis for SillaJen
What Is SillaJen's Debt?
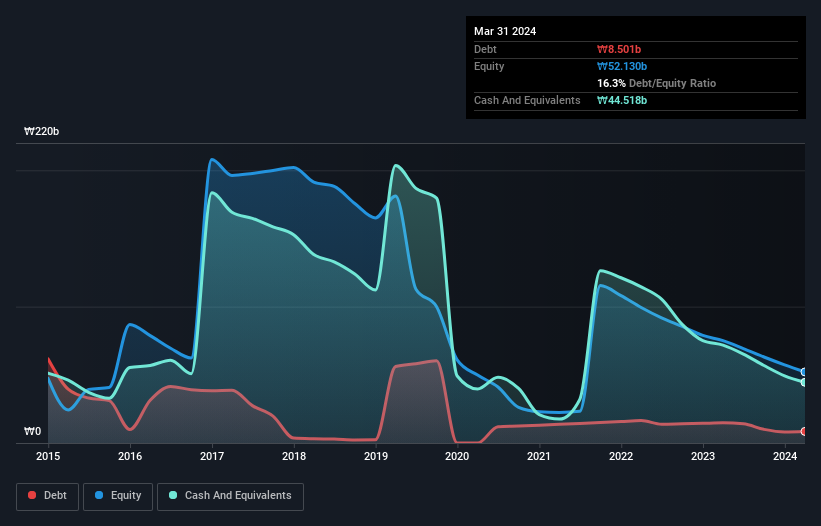
You can click the graphic below for the historical numbers, but it shows that SillaJen had ₩8.50b of debt in March 2024, down from ₩14.8b, one year before. But on the other hand it also has ₩44.5b in cash, leading to a ₩36.0b net cash position.
How Strong Is SillaJen's Balance Sheet?
The latest balance sheet data shows that SillaJen had liabilities of ₩10.2b due within a year, and liabilities of ₩9.31b falling due after that. Offsetting these obligations, it had cash of ₩44.5b as well as receivables valued at ₩866.3m due within 12 months. So it can boast ₩25.8b more liquid assets than total liabilities.
This surplus suggests that SillaJen has a conservative balance sheet, and could probably eliminate its debt without much difficulty. Succinctly put, SillaJen boasts net cash, so it's fair to say it does not have a heavy debt load! The balance sheet is clearly the area to focus on when you are analysing debt. But you can't view debt in total isolation; since SillaJen will need earnings to service that debt. So if you're keen to discover more about its earnings, it might be worth checking out this graph of its long term earnings trend.
Over 12 months, SillaJen made a loss at the EBIT level, and saw its revenue drop to ₩3.4b, which is a fall of 35%. To be frank that doesn't bode well.
So How Risky Is SillaJen?
We have no doubt that loss making companies are, in general, riskier than profitable ones. And the fact is that over the last twelve months SillaJen lost money at the earnings before interest and tax (EBIT) line. Indeed, in that time it burnt through ₩19b of cash and made a loss of ₩22b. However, it has net cash of ₩36.0b, so it has a bit of time before it will need more capital. Even though its balance sheet seems sufficiently liquid, debt always makes us a little nervous if a company doesn't produce free cash flow regularly. When analysing debt levels, the balance sheet is the obvious place to start. However, not all investment risk resides within the balance sheet - far from it. To that end, you should be aware of the 1 warning sign we've spotted with SillaJen .
At the end of the day, it's often better to focus on companies that are free from net debt. You can access our special list of such companies (all with a track record of profit growth). It's free.
If you're looking to trade SillaJen, open an account with the lowest-cost platform trusted by professionals, Interactive Brokers.
With clients in over 200 countries and territories, and access to 160 markets, IBKR lets you trade stocks, options, futures, forex, bonds and funds from a single integrated account.
Enjoy no hidden fees, no account minimums, and FX conversion rates as low as 0.03%, far better than what most brokers offer.
Sponsored ContentNew: Manage All Your Stock Portfolios in One Place
We've created the ultimate portfolio companion for stock investors, and it's free.
• Connect an unlimited number of Portfolios and see your total in one currency
• Be alerted to new Warning Signs or Risks via email or mobile
• Track the Fair Value of your stocks
Have feedback on this article? Concerned about the content? Get in touch with us directly. Alternatively, email editorial-team (at) simplywallst.com.
This article by Simply Wall St is general in nature. We provide commentary based on historical data and analyst forecasts only using an unbiased methodology and our articles are not intended to be financial advice. It does not constitute a recommendation to buy or sell any stock, and does not take account of your objectives, or your financial situation. We aim to bring you long-term focused analysis driven by fundamental data. Note that our analysis may not factor in the latest price-sensitive company announcements or qualitative material. Simply Wall St has no position in any stocks mentioned.
Have feedback on this article? Concerned about the content? Get in touch with us directly. Alternatively, email editorial-team@simplywallst.com
About KOSDAQ:A215600
SillaJen
Develops and commercializes oncolytic immunotherapy products in South Korea.
Excellent balance sheet low.
Market Insights

Community Narratives


