- South Korea
- /
- Pharma
- /
- KOSDAQ:A214370
Do Its Financials Have Any Role To Play In Driving Caregen Co., Ltd.'s (KOSDAQ:214370) Stock Up Recently?


Most readers would already be aware that Caregen's (KOSDAQ:214370) stock increased significantly by 28% over the past three months. Given that stock prices are usually aligned with a company's financial performance in the long-term, we decided to study its financial indicators more closely to see if they had a hand to play in the recent price move. Particularly, we will be paying attention to Caregen's ROE today.
Return on equity or ROE is an important factor to be considered by a shareholder because it tells them how effectively their capital is being reinvested. Put another way, it reveals the company's success at turning shareholder investments into profits.
See our latest analysis for Caregen
How To Calculate Return On Equity?
The formula for ROE is:
Return on Equity = Net Profit (from continuing operations) ÷ Shareholders' Equity
So, based on the above formula, the ROE for Caregen is:
15% = ₩28b ÷ ₩194b (Based on the trailing twelve months to September 2020).
The 'return' is the profit over the last twelve months. So, this means that for every ₩1 of its shareholder's investments, the company generates a profit of ₩0.15.
What Is The Relationship Between ROE And Earnings Growth?
Thus far, we have learned that ROE measures how efficiently a company is generating its profits. Based on how much of its profits the company chooses to reinvest or "retain", we are then able to evaluate a company's future ability to generate profits. Assuming everything else remains unchanged, the higher the ROE and profit retention, the higher the growth rate of a company compared to companies that don't necessarily bear these characteristics.
A Side By Side comparison of Caregen's Earnings Growth And 15% ROE
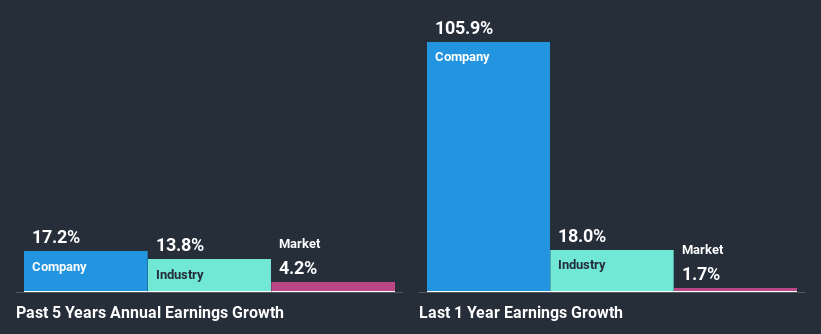
To begin with, Caregen seems to have a respectable ROE. Further, the company's ROE compares quite favorably to the industry average of 7.6%. This probably laid the ground for Caregen's moderate 17% net income growth seen over the past five years.
As a next step, we compared Caregen's net income growth with the industry, and pleasingly, we found that the growth seen by the company is higher than the average industry growth of 14%.
Earnings growth is a huge factor in stock valuation. It’s important for an investor to know whether the market has priced in the company's expected earnings growth (or decline). By doing so, they will have an idea if the stock is headed into clear blue waters or if swampy waters await. One good indicator of expected earnings growth is the P/E ratio which determines the price the market is willing to pay for a stock based on its earnings prospects. So, you may want to check if Caregen is trading on a high P/E or a low P/E, relative to its industry.
Is Caregen Using Its Retained Earnings Effectively?
The high three-year median payout ratio of 98% (or a retention ratio of 1.9%) for Caregen suggests that the company's growth wasn't really hampered despite it returning most of its income to its shareholders.
While Caregen has been growing its earnings, it only recently started to pay dividends which likely means that the company decided to impress new and existing shareholders with a dividend.
Conclusion
In total, it does look like Caregen has some positive aspects to its business. Especially the growth in earnings which was backed by an impressive ROE. Still, the high ROE could have been even more beneficial to investors had the company been reinvesting more of its profits. As highlighted earlier, the current reinvestment rate appears to be negligible. So far, we've only made a quick discussion around the company's earnings growth. So it may be worth checking this free detailed graph of Caregen's past earnings, as well as revenue and cash flows to get a deeper insight into the company's performance.
When trading Caregen or any other investment, use the platform considered by many to be the Professional's Gateway to the Worlds Market, Interactive Brokers. You get the lowest-cost* trading on stocks, options, futures, forex, bonds and funds worldwide from a single integrated account. Promoted
New: AI Stock Screener & Alerts
Our new AI Stock Screener scans the market every day to uncover opportunities.
• Dividend Powerhouses (3%+ Yield)
• Undervalued Small Caps with Insider Buying
• High growth Tech and AI Companies
Or build your own from over 50 metrics.
This article by Simply Wall St is general in nature. It does not constitute a recommendation to buy or sell any stock, and does not take account of your objectives, or your financial situation. We aim to bring you long-term focused analysis driven by fundamental data. Note that our analysis may not factor in the latest price-sensitive company announcements or qualitative material. Simply Wall St has no position in any stocks mentioned.
*Interactive Brokers Rated Lowest Cost Broker by StockBrokers.com Annual Online Review 2020
Have feedback on this article? Concerned about the content? Get in touch with us directly. Alternatively, email editorial-team (at) simplywallst.com.
About KOSDAQ:A214370
Caregen
A biotechnology company, researches, develops, and commercializes biomimetic peptides worldwide.
Flawless balance sheet with high growth potential.
Market Insights

Community Narratives

