- South Korea
- /
- Pharma
- /
- KOSDAQ:A053950
Kyung Nam Pharm Co.,Ltd. (KOSDAQ:053950) Stock Rockets 37% As Investors Are Less Pessimistic Than Expected


Kyung Nam Pharm Co.,Ltd. (KOSDAQ:053950) shareholders are no doubt pleased to see that the share price has bounced 37% in the last month, although it is still struggling to make up recently lost ground. Not all shareholders will be feeling jubilant, since the share price is still down a very disappointing 27% in the last twelve months.
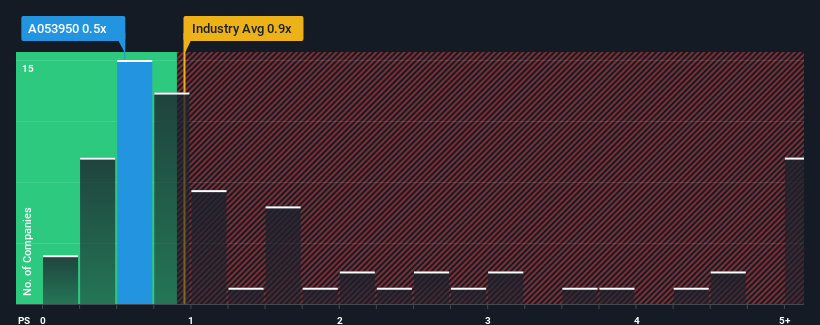
Although its price has surged higher, there still wouldn't be many who think Kyung Nam PharmLtd's price-to-sales (or "P/S") ratio of 0.5x is worth a mention when the median P/S in Korea's Pharmaceuticals industry is similar at about 0.9x. While this might not raise any eyebrows, if the P/S ratio is not justified investors could be missing out on a potential opportunity or ignoring looming disappointment.
View our latest analysis for Kyung Nam PharmLtd
How Kyung Nam PharmLtd Has Been Performing
The revenue growth achieved at Kyung Nam PharmLtd over the last year would be more than acceptable for most companies. Perhaps the market is expecting future revenue performance to only keep up with the broader industry, which has keeping the P/S in line with expectations. Those who are bullish on Kyung Nam PharmLtd will be hoping that this isn't the case, so that they can pick up the stock at a lower valuation.
Want the full picture on earnings, revenue and cash flow for the company? Then our free report on Kyung Nam PharmLtd will help you shine a light on its historical performance.What Are Revenue Growth Metrics Telling Us About The P/S?
There's an inherent assumption that a company should be matching the industry for P/S ratios like Kyung Nam PharmLtd's to be considered reasonable.
Retrospectively, the last year delivered an exceptional 21% gain to the company's top line. Although, its longer-term performance hasn't been as strong with three-year revenue growth being relatively non-existent overall. Therefore, it's fair to say that revenue growth has been inconsistent recently for the company.
This is in contrast to the rest of the industry, which is expected to grow by 61% over the next year, materially higher than the company's recent medium-term annualised growth rates.
With this information, we find it interesting that Kyung Nam PharmLtd is trading at a fairly similar P/S compared to the industry. Apparently many investors in the company are less bearish than recent times would indicate and aren't willing to let go of their stock right now. They may be setting themselves up for future disappointment if the P/S falls to levels more in line with recent growth rates.
The Key Takeaway
Kyung Nam PharmLtd appears to be back in favour with a solid price jump bringing its P/S back in line with other companies in the industry Using the price-to-sales ratio alone to determine if you should sell your stock isn't sensible, however it can be a practical guide to the company's future prospects.
We've established that Kyung Nam PharmLtd's average P/S is a bit surprising since its recent three-year growth is lower than the wider industry forecast. When we see weak revenue with slower than industry growth, we suspect the share price is at risk of declining, bringing the P/S back in line with expectations. Unless there is a significant improvement in the company's medium-term performance, it will be difficult to prevent the P/S ratio from declining to a more reasonable level.
And what about other risks? Every company has them, and we've spotted 3 warning signs for Kyung Nam PharmLtd (of which 2 are a bit concerning!) you should know about.
If strong companies turning a profit tickle your fancy, then you'll want to check out this free list of interesting companies that trade on a low P/E (but have proven they can grow earnings).
If you're looking to trade Kyung Nam PharmLtd, open an account with the lowest-cost platform trusted by professionals, Interactive Brokers.
With clients in over 200 countries and territories, and access to 160 markets, IBKR lets you trade stocks, options, futures, forex, bonds and funds from a single integrated account.
Enjoy no hidden fees, no account minimums, and FX conversion rates as low as 0.03%, far better than what most brokers offer.
Sponsored ContentValuation is complex, but we're here to simplify it.
Discover if Kyung Nam PharmLtd might be undervalued or overvalued with our detailed analysis, featuring fair value estimates, potential risks, dividends, insider trades, and its financial condition.
Access Free AnalysisHave feedback on this article? Concerned about the content? Get in touch with us directly. Alternatively, email editorial-team (at) simplywallst.com.
This article by Simply Wall St is general in nature. We provide commentary based on historical data and analyst forecasts only using an unbiased methodology and our articles are not intended to be financial advice. It does not constitute a recommendation to buy or sell any stock, and does not take account of your objectives, or your financial situation. We aim to bring you long-term focused analysis driven by fundamental data. Note that our analysis may not factor in the latest price-sensitive company announcements or qualitative material. Simply Wall St has no position in any stocks mentioned.
About KOSDAQ:A053950
Kyung Nam PharmLtd
Engages in the manufacture and sale of pharmaceutical, cosmetic, chemical, and health functional food products in South Korea, North America, and rest of Asia.
Excellent balance sheet low.
Market Insights

Community Narratives


