
Advertisement
- South Korea
- /
- Entertainment
- /
- KOSDAQ:A204610
Is T3 Entertainment Inc.'s (KOSDAQ:204610) Recent Stock Performance Influenced By Its Fundamentals In Any Way?
Most readers would already be aware that T3 Entertainment's (KOSDAQ:204610) stock increased significantly by 11% over the past week. Given that stock prices are usually aligned with a company's financial performance in the long-term, we decided to study its financial indicators more closely to see if they had a hand to play in the recent price move. In this article, we decided to focus on T3 Entertainment's ROE.
Return on Equity or ROE is a test of how effectively a company is growing its value and managing investors’ money. In short, ROE shows the profit each dollar generates with respect to its shareholder investments.
How To Calculate Return On Equity?
Return on equity can be calculated by using the formula:
Return on Equity = Net Profit (from continuing operations) ÷ Shareholders' Equity
So, based on the above formula, the ROE for T3 Entertainment is:
13% = ₩14b ÷ ₩108b (Based on the trailing twelve months to June 2025).
The 'return' refers to a company's earnings over the last year. That means that for every ₩1 worth of shareholders' equity, the company generated ₩0.13 in profit.
Check out our latest analysis for T3 Entertainment
What Has ROE Got To Do With Earnings Growth?
So far, we've learned that ROE is a measure of a company's profitability. Depending on how much of these profits the company reinvests or "retains", and how effectively it does so, we are then able to assess a company’s earnings growth potential. Assuming all else is equal, companies that have both a higher return on equity and higher profit retention are usually the ones that have a higher growth rate when compared to companies that don't have the same features.
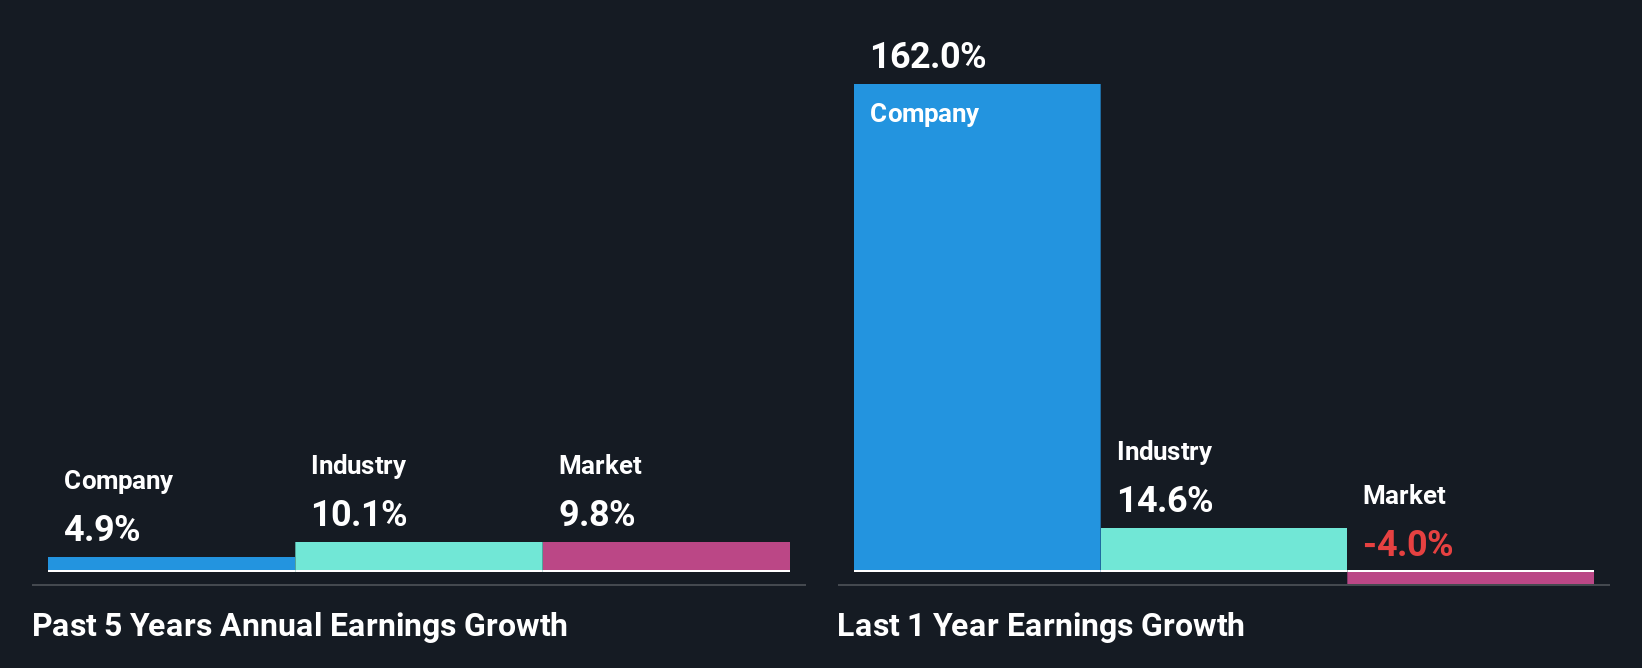
A Side By Side comparison of T3 Entertainment's Earnings Growth And 13% ROE
At first glance, T3 Entertainment seems to have a decent ROE. Further, the company's ROE compares quite favorably to the industry average of 10%. Yet, T3 Entertainment has posted measly growth of 4.9% over the past five years. This is interesting as the high returns should mean that the company has the ability to generate high growth but for some reason, it hasn't been able to do so. Such a scenario is likely to take place when a company pays out a huge portion of its earnings as dividends, or is faced with competitive pressures.
Next, on comparing with the industry net income growth, we found that T3 Entertainment's reported growth was lower than the industry growth of 10% over the last few years, which is not something we like to see.
The basis for attaching value to a company is, to a great extent, tied to its earnings growth. What investors need to determine next is if the expected earnings growth, or the lack of it, is already built into the share price. By doing so, they will have an idea if the stock is headed into clear blue waters or if swampy waters await. If you're wondering about T3 Entertainment's's valuation, check out this gauge of its price-to-earnings ratio, as compared to its industry.
Is T3 Entertainment Making Efficient Use Of Its Profits?
Despite having a normal three-year median payout ratio of 29% (or a retention ratio of 71% over the past three years, T3 Entertainment has seen very little growth in earnings as we saw above. Therefore, there might be some other reasons to explain the lack in that respect. For example, the business could be in decline.
In addition, T3 Entertainment has been paying dividends over a period of three years suggesting that keeping up dividend payments is way more important to the management even if it comes at the cost of business growth.
Conclusion
In total, it does look like T3 Entertainment has some positive aspects to its business. Yet, the low earnings growth is a bit concerning, especially given that the company has a high rate of return and is reinvesting ma huge portion of its profits. By the looks of it, there could be some other factors, not necessarily in control of the business, that's preventing growth. While we won't completely dismiss the company, what we would do, is try to ascertain how risky the business is to make a more informed decision around the company. You can see the 1 risk we have identified for T3 Entertainment by visiting our risks dashboard for free on our platform here.
Valuation is complex, but we're here to simplify it.
Discover if T3 Entertainment might be undervalued or overvalued with our detailed analysis, featuring fair value estimates, potential risks, dividends, insider trades, and its financial condition.
Access Free AnalysisHave feedback on this article? Concerned about the content? Get in touch with us directly. Alternatively, email editorial-team (at) simplywallst.com.
This article by Simply Wall St is general in nature. We provide commentary based on historical data and analyst forecasts only using an unbiased methodology and our articles are not intended to be financial advice. It does not constitute a recommendation to buy or sell any stock, and does not take account of your objectives, or your financial situation. We aim to bring you long-term focused analysis driven by fundamental data. Note that our analysis may not factor in the latest price-sensitive company announcements or qualitative material. Simply Wall St has no position in any stocks mentioned.
About KOSDAQ:A204610
T3 Entertainment
Develops games for PCs, mobiles, and consoles in South Korea and internationally.
Flawless balance sheet with solid track record.
Similar Companies
Market Insights

Advertisement
Community Narratives
A formidable player in AI and enterprise computing.
Fair Value US$210.00|3.1% overvalued
CO
Community Contributor
IREN's Bold Moves in Sustainable Bitcoin Mining & AI Data Centers
Fair Value US$72.52|11.6% undervalued
BL
Community Contributor
Cooling the Champions: The Aussie Tech Behind F1's Victories
Fair Value AU$12.40|40.4% undervalued
TR
Community Contributor