- South Korea
- /
- Media
- /
- KOSDAQ:A122450
As KX Innovation (KOSDAQ:122450) hikes 21% this past week, investors may now be noticing the company's three-year earnings growth


It's nice to see the KX Innovation Co., Ltd. (KOSDAQ:122450) share price up 21% in a week. But that doesn't change the fact that the returns over the last three years have been less than pleasing. After all, the share price is down 51% in the last three years, significantly under-performing the market.
The recent uptick of 21% could be a positive sign of things to come, so let's take a look at historical fundamentals.
View our latest analysis for KX Innovation
In his essay The Superinvestors of Graham-and-Doddsville Warren Buffett described how share prices do not always rationally reflect the value of a business. One imperfect but simple way to consider how the market perception of a company has shifted is to compare the change in the earnings per share (EPS) with the share price movement.
During the unfortunate three years of share price decline, KX Innovation actually saw its earnings per share (EPS) improve by 30% per year. Given the share price reaction, one might suspect that EPS is not a good guide to the business performance during the period (perhaps due to a one-off loss or gain). Alternatively, growth expectations may have been unreasonable in the past.
Since the change in EPS doesn't seem to correlate with the change in share price, it's worth taking a look at other metrics.
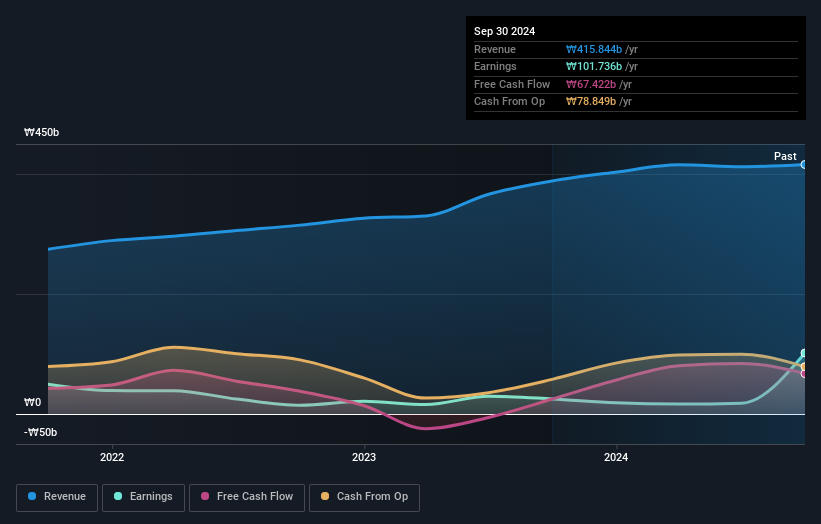
We note that the dividend seems healthy enough, so that probably doesn't explain the share price drop. It's good to see that KX Innovation has increased its revenue over the last three years. But it's not clear to us why the share price is down. It might be worth diving deeper into the fundamentals, lest an opportunity goes begging.
The company's revenue and earnings (over time) are depicted in the image below (click to see the exact numbers).
Take a more thorough look at KX Innovation's financial health with this free report on its balance sheet.
What About Dividends?
When looking at investment returns, it is important to consider the difference between total shareholder return (TSR) and share price return. The TSR incorporates the value of any spin-offs or discounted capital raisings, along with any dividends, based on the assumption that the dividends are reinvested. So for companies that pay a generous dividend, the TSR is often a lot higher than the share price return. As it happens, KX Innovation's TSR for the last 3 years was -44%, which exceeds the share price return mentioned earlier. And there's no prize for guessing that the dividend payments largely explain the divergence!
A Different Perspective
While the broader market lost about 0.7% in the twelve months, KX Innovation shareholders did even worse, losing 23% (even including dividends). Having said that, it's inevitable that some stocks will be oversold in a falling market. The key is to keep your eyes on the fundamental developments. Longer term investors wouldn't be so upset, since they would have made 9%, each year, over five years. If the fundamental data continues to indicate long term sustainable growth, the current sell-off could be an opportunity worth considering. I find it very interesting to look at share price over the long term as a proxy for business performance. But to truly gain insight, we need to consider other information, too. Take risks, for example - KX Innovation has 2 warning signs we think you should be aware of.
If you like to buy stocks alongside management, then you might just love this free list of companies. (Hint: many of them are unnoticed AND have attractive valuation).
Please note, the market returns quoted in this article reflect the market weighted average returns of stocks that currently trade on South Korean exchanges.
Valuation is complex, but we're here to simplify it.
Discover if KX Innovation might be undervalued or overvalued with our detailed analysis, featuring fair value estimates, potential risks, dividends, insider trades, and its financial condition.
Access Free AnalysisHave feedback on this article? Concerned about the content? Get in touch with us directly. Alternatively, email editorial-team (at) simplywallst.com.
This article by Simply Wall St is general in nature. We provide commentary based on historical data and analyst forecasts only using an unbiased methodology and our articles are not intended to be financial advice. It does not constitute a recommendation to buy or sell any stock, and does not take account of your objectives, or your financial situation. We aim to bring you long-term focused analysis driven by fundamental data. Note that our analysis may not factor in the latest price-sensitive company announcements or qualitative material. Simply Wall St has no position in any stocks mentioned.
About KOSDAQ:A122450
Solid track record with excellent balance sheet and pays a dividend.
Market Insights

Community Narratives

