- South Korea
- /
- Chemicals
- /
- KOSDAQ:A251370
What YMT Co., Ltd.'s (KOSDAQ:251370) 34% Share Price Gain Is Not Telling You

The YMT Co., Ltd. (KOSDAQ:251370) share price has done very well over the last month, posting an excellent gain of 34%. The last 30 days bring the annual gain to a very sharp 53%.
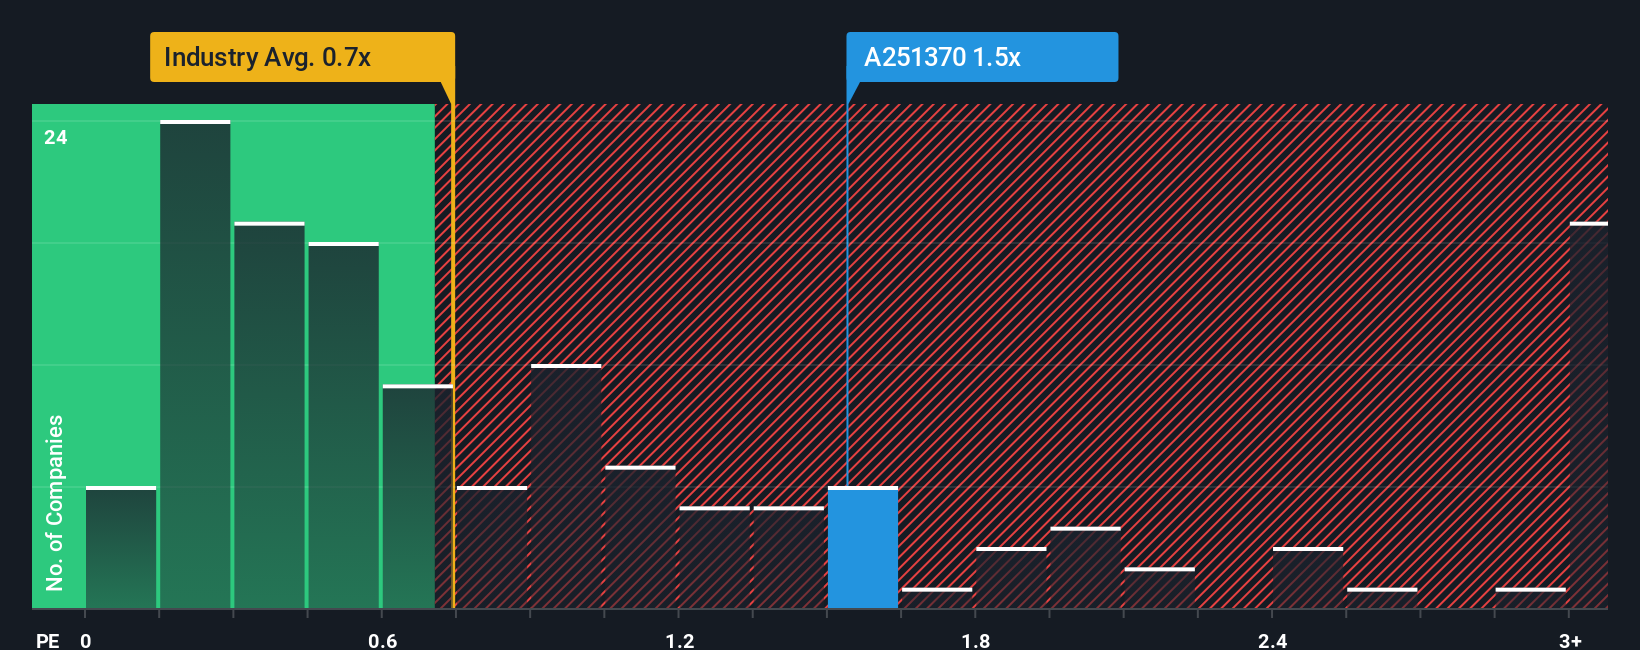
Since its price has surged higher, given close to half the companies operating in Korea's Chemicals industry have price-to-sales ratios (or "P/S") below 0.7x, you may consider YMT as a stock to potentially avoid with its 1.5x P/S ratio. However, the P/S might be high for a reason and it requires further investigation to determine if it's justified.
View our latest analysis for YMT
What Does YMT's P/S Mean For Shareholders?
The recent revenue growth at YMT would have to be considered satisfactory if not spectacular. One possibility is that the P/S ratio is high because investors think this good revenue growth will be enough to outperform the broader industry in the near future. You'd really hope so, otherwise you're paying a pretty hefty price for no particular reason.
We don't have analyst forecasts, but you can see how recent trends are setting up the company for the future by checking out our free report on YMT's earnings, revenue and cash flow.Is There Enough Revenue Growth Forecasted For YMT?
The only time you'd be truly comfortable seeing a P/S as high as YMT's is when the company's growth is on track to outshine the industry.
If we review the last year of revenue growth, the company posted a worthy increase of 6.4%. The solid recent performance means it was also able to grow revenue by 5.9% in total over the last three years. Therefore, it's fair to say the revenue growth recently has been respectable for the company.
This is in contrast to the rest of the industry, which is expected to grow by 11% over the next year, materially higher than the company's recent medium-term annualised growth rates.
In light of this, it's alarming that YMT's P/S sits above the majority of other companies. It seems most investors are ignoring the fairly limited recent growth rates and are hoping for a turnaround in the company's business prospects. There's a good chance existing shareholders are setting themselves up for future disappointment if the P/S falls to levels more in line with recent growth rates.
What We Can Learn From YMT's P/S?
YMT's P/S is on the rise since its shares have risen strongly. While the price-to-sales ratio shouldn't be the defining factor in whether you buy a stock or not, it's quite a capable barometer of revenue expectations.
Our examination of YMT revealed its poor three-year revenue trends aren't detracting from the P/S as much as we though, given they look worse than current industry expectations. When we observe slower-than-industry revenue growth alongside a high P/S ratio, we assume there to be a significant risk of the share price decreasing, which would result in a lower P/S ratio. Unless the recent medium-term conditions improve markedly, it's very challenging to accept these the share price as being reasonable.
And what about other risks? Every company has them, and we've spotted 2 warning signs for YMT (of which 1 doesn't sit too well with us!) you should know about.
If companies with solid past earnings growth is up your alley, you may wish to see this free collection of other companies with strong earnings growth and low P/E ratios.
Mobile Infrastructure for Defense and Disaster
The next wave in robotics isn't humanoid. Its fully autonomous towers delivering 5G, ISR, and radar in under 30 minutes, anywhere.
Get the investor briefing before the next round of contracts
Sponsored On Behalf of CiTechNew: Manage All Your Stock Portfolios in One Place
We've created the ultimate portfolio companion for stock investors, and it's free.
• Connect an unlimited number of Portfolios and see your total in one currency
• Be alerted to new Warning Signs or Risks via email or mobile
• Track the Fair Value of your stocks
Have feedback on this article? Concerned about the content? Get in touch with us directly. Alternatively, email editorial-team (at) simplywallst.com.
This article by Simply Wall St is general in nature. We provide commentary based on historical data and analyst forecasts only using an unbiased methodology and our articles are not intended to be financial advice. It does not constitute a recommendation to buy or sell any stock, and does not take account of your objectives, or your financial situation. We aim to bring you long-term focused analysis driven by fundamental data. Note that our analysis may not factor in the latest price-sensitive company announcements or qualitative material. Simply Wall St has no position in any stocks mentioned.
About KOSDAQ:A251370
YMT
Develops and sells chemical and electronic materials for the electronic material industry in South Korea and internationally.
Mediocre balance sheet with questionable track record.
Market Insights

Weekly Picks

Early mover in a fast growing industry. Likely to experience share price volatility as they scale


A case for CA$31.80 (undiluted), aka 8,616% upside from CA$0.37 (an 86 bagger!).


Moderation and Stabilisation: HOLD: Fair Price based on a 4-year Cycle is $12.08
Recently Updated Narratives

Amazon: Why the World’s Biggest Platform Still Runs on Invisible Economics

Sunrun Stock: When the Energy Transition Collides With the Cost of Capital

Salesforce Stock: AI-Fueled Growth Is Real — But Can Margins Stay This Strong?
Popular Narratives


MicroVision will explode future revenue by 380.37% with a vision towards success


Crazy Undervalued 42 Baggers Silver Play (Active & Running Mine)


