
David Iben put it well when he said, 'Volatility is not a risk we care about. What we care about is avoiding the permanent loss of capital.' It's only natural to consider a company's balance sheet when you examine how risky it is, since debt is often involved when a business collapses. Importantly, NDFOS Co., Ltd. (KOSDAQ:238090) does carry debt. But the real question is whether this debt is making the company risky.
Why Does Debt Bring Risk?
Debt and other liabilities become risky for a business when it cannot easily fulfill those obligations, either with free cash flow or by raising capital at an attractive price. In the worst case scenario, a company can go bankrupt if it cannot pay its creditors. However, a more frequent (but still costly) occurrence is where a company must issue shares at bargain-basement prices, permanently diluting shareholders, just to shore up its balance sheet. Having said that, the most common situation is where a company manages its debt reasonably well - and to its own advantage. The first step when considering a company's debt levels is to consider its cash and debt together.
View our latest analysis for NDFOS
What Is NDFOS's Net Debt?
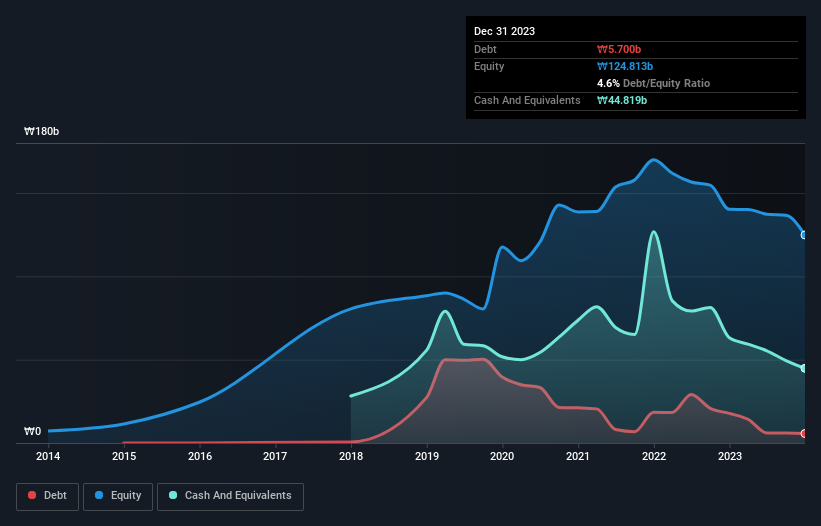
The image below, which you can click on for greater detail, shows that NDFOS had debt of ₩5.70b at the end of December 2023, a reduction from ₩17.8b over a year. But on the other hand it also has ₩44.8b in cash, leading to a ₩39.1b net cash position.
How Strong Is NDFOS' Balance Sheet?
We can see from the most recent balance sheet that NDFOS had liabilities of ₩10.1b falling due within a year, and liabilities of ₩6.23b due beyond that. On the other hand, it had cash of ₩44.8b and ₩12.5b worth of receivables due within a year. So it actually has ₩41.0b more liquid assets than total liabilities.
This excess liquidity is a great indication that NDFOS' balance sheet is almost as strong as Fort Knox. With this in mind one could posit that its balance sheet means the company is able to handle some adversity. Simply put, the fact that NDFOS has more cash than debt is arguably a good indication that it can manage its debt safely. The balance sheet is clearly the area to focus on when you are analysing debt. But it is NDFOS's earnings that will influence how the balance sheet holds up in the future. So if you're keen to discover more about its earnings, it might be worth checking out this graph of its long term earnings trend.
Over 12 months, NDFOS made a loss at the EBIT level, and saw its revenue drop to ₩49b, which is a fall of 45%. To be frank that doesn't bode well.
So How Risky Is NDFOS?
Statistically speaking companies that lose money are riskier than those that make money. And the fact is that over the last twelve months NDFOS lost money at the earnings before interest and tax (EBIT) line. Indeed, in that time it burnt through ₩4.5b of cash and made a loss of ₩11b. But the saving grace is the ₩39.1b on the balance sheet. That kitty means the company can keep spending for growth for at least two years, at current rates. Even though its balance sheet seems sufficiently liquid, debt always makes us a little nervous if a company doesn't produce free cash flow regularly. There's no doubt that we learn most about debt from the balance sheet. However, not all investment risk resides within the balance sheet - far from it. Be aware that NDFOS is showing 2 warning signs in our investment analysis , and 1 of those doesn't sit too well with us...
When all is said and done, sometimes its easier to focus on companies that don't even need debt. Readers can access a list of growth stocks with zero net debt 100% free, right now.
Mobile Infrastructure for Defense and Disaster
The next wave in robotics isn't humanoid. Its fully autonomous towers delivering 5G, ISR, and radar in under 30 minutes, anywhere.
Get the investor briefing before the next round of contracts
Sponsored On Behalf of CiTechValuation is complex, but we're here to simplify it.
Discover if NDFOS might be undervalued or overvalued with our detailed analysis, featuring fair value estimates, potential risks, dividends, insider trades, and its financial condition.
Access Free AnalysisHave feedback on this article? Concerned about the content? Get in touch with us directly. Alternatively, email editorial-team (at) simplywallst.com.
This article by Simply Wall St is general in nature. We provide commentary based on historical data and analyst forecasts only using an unbiased methodology and our articles are not intended to be financial advice. It does not constitute a recommendation to buy or sell any stock, and does not take account of your objectives, or your financial situation. We aim to bring you long-term focused analysis driven by fundamental data. Note that our analysis may not factor in the latest price-sensitive company announcements or qualitative material. Simply Wall St has no position in any stocks mentioned.
About KOSDAQ:A238090
Flawless balance sheet and slightly overvalued.
Market Insights

Weekly Picks

THE KINGDOM OF BROWN GOODS: WHY MGPI IS BEING CRUSHED BY INVENTORY & PRIMED FOR RESURRECTION


Why Vertical Aerospace (NYSE: EVTL) is Worth Possibly Over 13x its Current Price


The Quiet Giant That Became AI’s Power Grid
Recently Updated Narratives
Why Vertical Aerospace (NYSE: EVTL) is Worth Possibly Over 13x its Current Price

Deep Value Multi Bagger Opportunity


A case for CA$31.80 (undiluted), aka 8,616% upside from CA$0.37 (an 86 bagger!).
Popular Narratives


MicroVision will explode future revenue by 380.37% with a vision towards success


NVDA: Expanding AI Demand Will Drive Major Data Center Investments Through 2026


Crazy Undervalued 42 Baggers Silver Play (Active & Running Mine)
Trending Discussion


Thanks for sharing these. They really help when I pick what dividend stocks to invest in
