
There are a few key trends to look for if we want to identify the next multi-bagger. One common approach is to try and find a company with returns on capital employed (ROCE) that are increasing, in conjunction with a growing amount of capital employed. Ultimately, this demonstrates that it's a business that is reinvesting profits at increasing rates of return. So when we looked at SANGBO (KOSDAQ:027580) and its trend of ROCE, we really liked what we saw.
Understanding Return On Capital Employed (ROCE)
For those who don't know, ROCE is a measure of a company's yearly pre-tax profit (its return), relative to the capital employed in the business. To calculate this metric for SANGBO, this is the formula:
Return on Capital Employed = Earnings Before Interest and Tax (EBIT) ÷ (Total Assets - Current Liabilities)
0.19 = ₩7.4b ÷ (₩111b - ₩72b) (Based on the trailing twelve months to December 2020).
Therefore, SANGBO has an ROCE of 19%. In absolute terms, that's a satisfactory return, but compared to the Chemicals industry average of 7.9% it's much better.
Check out our latest analysis for SANGBO
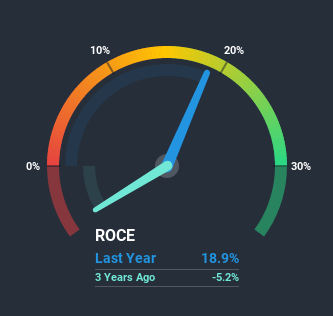
Historical performance is a great place to start when researching a stock so above you can see the gauge for SANGBO's ROCE against it's prior returns. If you're interested in investigating SANGBO's past further, check out this free graph of past earnings, revenue and cash flow.
What Can We Tell From SANGBO's ROCE Trend?
We're delighted to see that SANGBO is reaping rewards from its investments and has now broken into profitability. Historically the company was generating losses but as we can see from the latest figures referenced above, they're now earning 19% on their capital employed. In regards to capital employed, SANGBO is using 52% less capital than it was five years ago, which on the surface, can indicate that the business has become more efficient at generating these returns. The reduction could indicate that the company is selling some assets, and considering returns are up, they appear to be selling the right ones.
For the record though, there was a noticeable increase in the company's current liabilities over the period, so we would attribute some of the ROCE growth to that. Essentially the business now has suppliers or short-term creditors funding about 65% of its operations, which isn't ideal. Given it's pretty high ratio, we'd remind investors that having current liabilities at those levels can bring about some risks in certain businesses.
The Bottom Line On SANGBO's ROCE
From what we've seen above, SANGBO has managed to increase it's returns on capital all the while reducing it's capital base. Given the stock has declined 60% in the last five years, this could be a good investment if the valuation and other metrics are also appealing. So researching this company further and determining whether or not these trends will continue seems justified.
On a final note, we found 3 warning signs for SANGBO (1 is concerning) you should be aware of.
While SANGBO may not currently earn the highest returns, we've compiled a list of companies that currently earn more than 25% return on equity. Check out this free list here.
If you decide to trade SANGBO, use the lowest-cost* platform that is rated #1 Overall by Barron’s, Interactive Brokers. Trade stocks, options, futures, forex, bonds and funds on 135 markets, all from a single integrated account. Promoted
The New Payments ETF Is Live on NASDAQ:
Money is moving to real-time rails, and a newly listed ETF now gives investors direct exposure. Fast settlement. Institutional custody. Simple access.
Explore how this launch could reshape portfolios
Sponsored ContentNew: Manage All Your Stock Portfolios in One Place
We've created the ultimate portfolio companion for stock investors, and it's free.
• Connect an unlimited number of Portfolios and see your total in one currency
• Be alerted to new Warning Signs or Risks via email or mobile
• Track the Fair Value of your stocks
This article by Simply Wall St is general in nature. It does not constitute a recommendation to buy or sell any stock, and does not take account of your objectives, or your financial situation. We aim to bring you long-term focused analysis driven by fundamental data. Note that our analysis may not factor in the latest price-sensitive company announcements or qualitative material. Simply Wall St has no position in any stocks mentioned.
*Interactive Brokers Rated Lowest Cost Broker by StockBrokers.com Annual Online Review 2020
Have feedback on this article? Concerned about the content? Get in touch with us directly. Alternatively, email editorial-team (at) simplywallst.com.
About KOSDAQ:A027580
SANGBO
Manufactures and sells thin films, and nano coating and materials in South Korea and internationally.
Flawless balance sheet with very low risk.
Market Insights

Weekly Picks

THE KINGDOM OF BROWN GOODS: WHY MGPI IS BEING CRUSHED BY INVENTORY & PRIMED FOR RESURRECTION


Why Vertical Aerospace (NYSE: EVTL) is Worth Possibly Over 13x its Current Price


The Quiet Giant That Became AI’s Power Grid
Recently Updated Narratives


MINISO's fair value is projected at 26.69 with an anticipated PE ratio shift of 20x

Fiverr International will transform the freelance industry with AI-powered growth

Jackson Financial Stock: When Insurance Math Meets a Shifting Claims Landscape
Popular Narratives


MicroVision will explode future revenue by 380.37% with a vision towards success


Crazy Undervalued 42 Baggers Silver Play (Active & Running Mine)


