
Advertisement
- South Korea
- /
- Metals and Mining
- /
- KOSDAQ:A026910
What Kwang Jin Ind. Co., Ltd.'s (KOSDAQ:026910) 25% Share Price Gain Is Not Telling You
Kwang Jin Ind. Co., Ltd. (KOSDAQ:026910) shares have had a really impressive month, gaining 25% after a shaky period beforehand. Not all shareholders will be feeling jubilant, since the share price is still down a very disappointing 28% in the last twelve months.
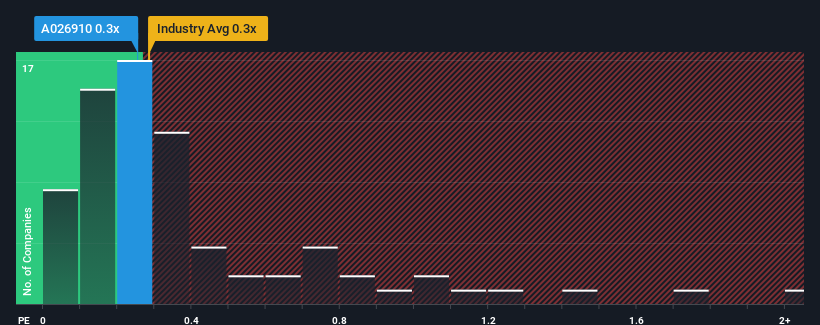
Although its price has surged higher, there still wouldn't be many who think Kwang Jin Ind's price-to-sales (or "P/S") ratio of 0.3x is worth a mention when it essentially matches the median P/S in Korea's Metals and Mining industry. However, investors might be overlooking a clear opportunity or potential setback if there is no rational basis for the P/S.
We've discovered 2 warning signs about Kwang Jin Ind. View them for free.View our latest analysis for Kwang Jin Ind
How Kwang Jin Ind Has Been Performing
Kwang Jin Ind has been doing a good job lately as it's been growing revenue at a solid pace. One possibility is that the P/S is moderate because investors think this respectable revenue growth might not be enough to outperform the broader industry in the near future. Those who are bullish on Kwang Jin Ind will be hoping that this isn't the case, so that they can pick up the stock at a lower valuation.
We don't have analyst forecasts, but you can see how recent trends are setting up the company for the future by checking out our free report on Kwang Jin Ind's earnings, revenue and cash flow.How Is Kwang Jin Ind's Revenue Growth Trending?
Kwang Jin Ind's P/S ratio would be typical for a company that's only expected to deliver moderate growth, and importantly, perform in line with the industry.
Taking a look back first, we see that the company managed to grow revenues by a handy 9.0% last year. Revenue has also lifted 7.2% in aggregate from three years ago, partly thanks to the last 12 months of growth. Therefore, it's fair to say the revenue growth recently has been respectable for the company.
Comparing that to the industry, which is predicted to deliver 14% growth in the next 12 months, the company's momentum is weaker, based on recent medium-term annualised revenue results.
With this in mind, we find it intriguing that Kwang Jin Ind's P/S is comparable to that of its industry peers. Apparently many investors in the company are less bearish than recent times would indicate and aren't willing to let go of their stock right now. They may be setting themselves up for future disappointment if the P/S falls to levels more in line with recent growth rates.
What We Can Learn From Kwang Jin Ind's P/S?
Its shares have lifted substantially and now Kwang Jin Ind's P/S is back within range of the industry median. We'd say the price-to-sales ratio's power isn't primarily as a valuation instrument but rather to gauge current investor sentiment and future expectations.
We've established that Kwang Jin Ind's average P/S is a bit surprising since its recent three-year growth is lower than the wider industry forecast. Right now we are uncomfortable with the P/S as this revenue performance isn't likely to support a more positive sentiment for long. If recent medium-term revenue trends continue, the probability of a share price decline will become quite substantial, placing shareholders at risk.
It is also worth noting that we have found 2 warning signs for Kwang Jin Ind (1 doesn't sit too well with us!) that you need to take into consideration.
It's important to make sure you look for a great company, not just the first idea you come across. So if growing profitability aligns with your idea of a great company, take a peek at this free list of interesting companies with strong recent earnings growth (and a low P/E).
Valuation is complex, but we're here to simplify it.
Discover if Kwang Jin Ind might be undervalued or overvalued with our detailed analysis, featuring fair value estimates, potential risks, dividends, insider trades, and its financial condition.
Access Free AnalysisHave feedback on this article? Concerned about the content? Get in touch with us directly. Alternatively, email editorial-team (at) simplywallst.com.
This article by Simply Wall St is general in nature. We provide commentary based on historical data and analyst forecasts only using an unbiased methodology and our articles are not intended to be financial advice. It does not constitute a recommendation to buy or sell any stock, and does not take account of your objectives, or your financial situation. We aim to bring you long-term focused analysis driven by fundamental data. Note that our analysis may not factor in the latest price-sensitive company announcements or qualitative material. Simply Wall St has no position in any stocks mentioned.
About KOSDAQ:A026910
Kwang Jin Ind
Manufactures and sells hot rolled, cold drawn, and peeled steel bars in South Korea.
Acceptable track record and slightly overvalued.
Market Insights

Advertisement
Community Narratives
MINISO's fair value is projected at 26.69 with an anticipated PE ratio shift of 20x
Fair Value US$24.03|11.0% undervalued
BE
Community Contributor
Procter & Gamble: A Dividend Giant Facing Slowing Growth
Fair Value US$119.81|23.3% overvalued
AN
Community Contributor
Eli Lilly's Future Growth Driven by Tirzepatide and Favorable Market Conditions
Fair Value US$1.19k|13.8% undervalued
EA
Community Contributor