

Did you know there are some financial metrics that can provide clues of a potential multi-bagger? Amongst other things, we'll want to see two things; firstly, a growing return on capital employed (ROCE) and secondly, an expansion in the company's amount of capital employed. Basically this means that a company has profitable initiatives that it can continue to reinvest in, which is a trait of a compounding machine. In light of that, when we looked at Sajo Industries (KRX:007160) and its ROCE trend, we weren't exactly thrilled.
Understanding Return On Capital Employed (ROCE)
For those that aren't sure what ROCE is, it measures the amount of pre-tax profits a company can generate from the capital employed in its business. The formula for this calculation on Sajo Industries is:
Return on Capital Employed = Earnings Before Interest and Tax (EBIT) ÷ (Total Assets - Current Liabilities)
0.025 = ₩18b ÷ (₩1.1t - ₩350b) (Based on the trailing twelve months to December 2020).
Therefore, Sajo Industries has an ROCE of 2.5%. In absolute terms, that's a low return and it also under-performs the Food industry average of 7.4%.
View our latest analysis for Sajo Industries
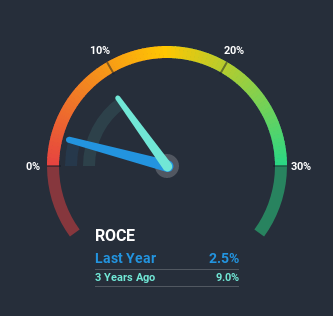
While the past is not representative of the future, it can be helpful to know how a company has performed historically, which is why we have this chart above. If you'd like to look at how Sajo Industries has performed in the past in other metrics, you can view this free graph of past earnings, revenue and cash flow.
What Does the ROCE Trend For Sajo Industries Tell Us?
When we looked at the ROCE trend at Sajo Industries, we didn't gain much confidence. Over the last five years, returns on capital have decreased to 2.5% from 6.9% five years ago. Given the business is employing more capital while revenue has slipped, this is a bit concerning. If this were to continue, you might be looking at a company that is trying to reinvest for growth but is actually losing market share since sales haven't increased.
On a side note, Sajo Industries has done well to pay down its current liabilities to 32% of total assets. That could partly explain why the ROCE has dropped. What's more, this can reduce some aspects of risk to the business because now the company's suppliers or short-term creditors are funding less of its operations. Since the business is basically funding more of its operations with it's own money, you could argue this has made the business less efficient at generating ROCE.
In Conclusion...
From the above analysis, we find it rather worrisome that returns on capital and sales for Sajo Industries have fallen, meanwhile the business is employing more capital than it was five years ago. It should come as no surprise then that the stock has fallen 11% over the last five years, so it looks like investors are recognizing these changes. That being the case, unless the underlying trends revert to a more positive trajectory, we'd consider looking elsewhere.
One final note, you should learn about the 4 warning signs we've spotted with Sajo Industries (including 2 which can't be ignored) .
While Sajo Industries isn't earning the highest return, check out this free list of companies that are earning high returns on equity with solid balance sheets.
If you’re looking to trade Sajo Industries, open an account with the lowest-cost* platform trusted by professionals, Interactive Brokers. Their clients from over 200 countries and territories trade stocks, options, futures, forex, bonds and funds worldwide from a single integrated account. Promoted
New: Manage All Your Stock Portfolios in One Place
We've created the ultimate portfolio companion for stock investors, and it's free.
• Connect an unlimited number of Portfolios and see your total in one currency
• Be alerted to new Warning Signs or Risks via email or mobile
• Track the Fair Value of your stocks
This article by Simply Wall St is general in nature. It does not constitute a recommendation to buy or sell any stock, and does not take account of your objectives, or your financial situation. We aim to bring you long-term focused analysis driven by fundamental data. Note that our analysis may not factor in the latest price-sensitive company announcements or qualitative material. Simply Wall St has no position in any stocks mentioned.
*Interactive Brokers Rated Lowest Cost Broker by StockBrokers.com Annual Online Review 2020
Have feedback on this article? Concerned about the content? Get in touch with us directly. Alternatively, email editorial-team (at) simplywallst.com.
About KOSE:A007160
Sajo Industries
Primarily operates as a food company in South Korea and internationally.
Low and slightly overvalued.
Market Insights

Community Narratives


