
Advertisement
- South Korea
- /
- Consumer Services
- /
- KOSDAQ:A057030
There's Reason For Concern Over YBM Net, Inc.'s (KOSDAQ:057030) Price
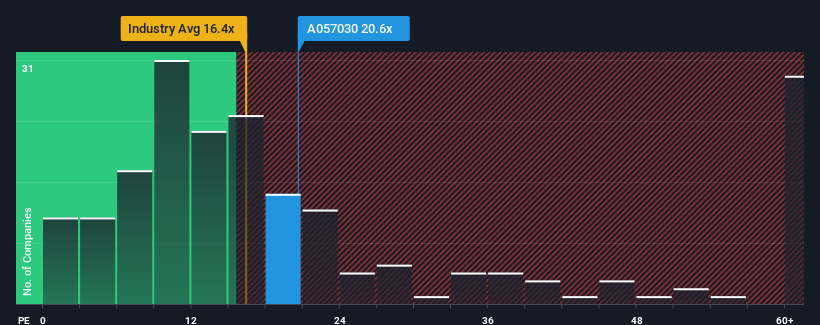
YBM Net, Inc.'s (KOSDAQ:057030) price-to-earnings (or "P/E") ratio of 20.6x might make it look like a strong sell right now compared to the market in Korea, where around half of the companies have P/E ratios below 11x and even P/E's below 6x are quite common. Although, it's not wise to just take the P/E at face value as there may be an explanation why it's so lofty.
As an illustration, earnings have deteriorated at YBM Net over the last year, which is not ideal at all. One possibility is that the P/E is high because investors think the company will still do enough to outperform the broader market in the near future. If not, then existing shareholders may be quite nervous about the viability of the share price.
View our latest analysis for YBM Net
What Are Growth Metrics Telling Us About The High P/E?
There's an inherent assumption that a company should far outperform the market for P/E ratios like YBM Net's to be considered reasonable.
Taking a look back first, the company's earnings per share growth last year wasn't something to get excited about as it posted a disappointing decline of 37%. This has soured the latest three-year period, which nevertheless managed to deliver a decent 25% overall rise in EPS. So we can start by confirming that the company has generally done a good job of growing earnings over that time, even though it had some hiccups along the way.
Comparing that to the market, which is predicted to deliver 22% growth in the next 12 months, the company's momentum is weaker based on recent medium-term annualised earnings results.
In light of this, it's alarming that YBM Net's P/E sits above the majority of other companies. It seems most investors are ignoring the fairly limited recent growth rates and are hoping for a turnaround in the company's business prospects. There's a good chance existing shareholders are setting themselves up for future disappointment if the P/E falls to levels more in line with recent growth rates.
The Final Word
Using the price-to-earnings ratio alone to determine if you should sell your stock isn't sensible, however it can be a practical guide to the company's future prospects.
Our examination of YBM Net revealed its three-year earnings trends aren't impacting its high P/E anywhere near as much as we would have predicted, given they look worse than current market expectations. When we see weak earnings with slower than market growth, we suspect the share price is at risk of declining, sending the high P/E lower. If recent medium-term earnings trends continue, it will place shareholders' investments at significant risk and potential investors in danger of paying an excessive premium.
Before you take the next step, you should know about the 3 warning signs for YBM Net that we have uncovered.
If you're unsure about the strength of YBM Net's business, why not explore our interactive list of stocks with solid business fundamentals for some other companies you may have missed.
New: Manage All Your Stock Portfolios in One Place
We've created the ultimate portfolio companion for stock investors, and it's free.
• Connect an unlimited number of Portfolios and see your total in one currency
• Be alerted to new Warning Signs or Risks via email or mobile
• Track the Fair Value of your stocks
Have feedback on this article? Concerned about the content? Get in touch with us directly. Alternatively, email editorial-team (at) simplywallst.com.
This article by Simply Wall St is general in nature. We provide commentary based on historical data and analyst forecasts only using an unbiased methodology and our articles are not intended to be financial advice. It does not constitute a recommendation to buy or sell any stock, and does not take account of your objectives, or your financial situation. We aim to bring you long-term focused analysis driven by fundamental data. Note that our analysis may not factor in the latest price-sensitive company announcements or qualitative material. Simply Wall St has no position in any stocks mentioned.
About KOSDAQ:A057030
Flawless balance sheet second-rate dividend payer.
Market Insights

Advertisement
Weekly Picks
FA

FAI on Arabian Internet and Communication Services ·
Solutions by stc: 34% Upside in Saudi's Digital Transformation Leader
Fair Value:ر.س342.2335.3% undervalued
9 followersusers have followed this narrative
1 commentusers have commented on this narrative
3 likesusers have liked this narrative
RO


RobertoAllende on NVIDIA ·
The AI Infrastructure Giant Grows Into Its Valuation
Fair Value:US$345.0747.9% undervalued
27 followersusers have followed this narrative
28 commentsusers have commented on this narrative
21 likesusers have liked this narrative
Recently Updated Narratives
HA

Haha94 on Perdana Petroleum Berhad ·
Perdana Petroleum Berhad is a Zombie Business with a 27.34% Profit Margin and inflation adjusted revenue Business
Fair Value:RM 0.2128.6% undervalued
1 followerusers have followed this narrative
0 commentsusers have commented on this narrative
0 likesusers have liked this narrative
AB
Abc on Global X Etfs Icav - Global X Silver Miners Ucits ETF ·
Many trends acting at the same time
Fair Value:€10068.5% undervalued
1 followerusers have followed this narrative
0 commentsusers have commented on this narrative
0 likesusers have liked this narrative
NI


niteco on Texas Instruments ·
Engineered for Stability. Positioned for Growth.
Fair Value:US$314.4446.5% undervalued
2 followersusers have followed this narrative
0 commentsusers have commented on this narrative
0 likesusers have liked this narrative
Popular Narratives
TH

TheWallstreetKing on MicroVision ·
MicroVision will explode future revenue by 380.37% with a vision towards success
Fair Value:US$6098.6% undervalued
109 followersusers have followed this narrative
11 commentsusers have commented on this narrative
22 likesusers have liked this narrative
AN

AnalystConsensusTarget on NVIDIA ·
NVDA: Expanding AI Demand Will Drive Major Data Center Investments Through 2026
Fair Value:US$250.3928.1% undervalued
941 followersusers have followed this narrative
6 commentsusers have commented on this narrative
24 likesusers have liked this narrative
OS


oscargarcia on Alphabet ·
The company that turned a verb into a global necessity and basically runs the modern internet, digital ads, smartphones, maps, and AI.
Fair Value:US$3407.4% undervalued
145 followersusers have followed this narrative
6 commentsusers have commented on this narrative
18 likesusers have liked this narrative