
Advertisement
Some say volatility, rather than debt, is the best way to think about risk as an investor, but Warren Buffett famously said that 'Volatility is far from synonymous with risk.' So it might be obvious that you need to consider debt, when you think about how risky any given stock is, because too much debt can sink a company. We can see that Pangrim Co., Ltd. (KRX:003610) does use debt in its business. But the more important question is: how much risk is that debt creating?
Why Does Debt Bring Risk?
Generally speaking, debt only becomes a real problem when a company can't easily pay it off, either by raising capital or with its own cash flow. Ultimately, if the company can't fulfill its legal obligations to repay debt, shareholders could walk away with nothing. However, a more frequent (but still costly) occurrence is where a company must issue shares at bargain-basement prices, permanently diluting shareholders, just to shore up its balance sheet. By replacing dilution, though, debt can be an extremely good tool for businesses that need capital to invest in growth at high rates of return. The first step when considering a company's debt levels is to consider its cash and debt together.
Check out our latest analysis for Pangrim
How Much Debt Does Pangrim Carry?
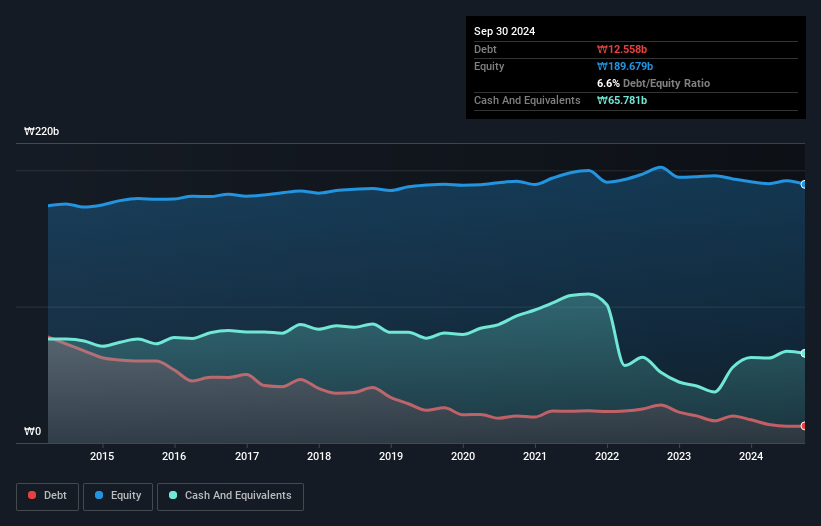
The image below, which you can click on for greater detail, shows that Pangrim had debt of ₩12.6b at the end of September 2024, a reduction from ₩19.9b over a year. But on the other hand it also has ₩65.8b in cash, leading to a ₩53.2b net cash position.
A Look At Pangrim's Liabilities
According to the last reported balance sheet, Pangrim had liabilities of ₩34.7b due within 12 months, and liabilities of ₩7.23b due beyond 12 months. On the other hand, it had cash of ₩65.8b and ₩11.8b worth of receivables due within a year. So it actually has ₩35.7b more liquid assets than total liabilities.
This surplus suggests that Pangrim is using debt in a way that is appears to be both safe and conservative. Because it has plenty of assets, it is unlikely to have trouble with its lenders. Simply put, the fact that Pangrim has more cash than debt is arguably a good indication that it can manage its debt safely. The balance sheet is clearly the area to focus on when you are analysing debt. But you can't view debt in total isolation; since Pangrim will need earnings to service that debt. So if you're keen to discover more about its earnings, it might be worth checking out this graph of its long term earnings trend.
Over 12 months, Pangrim made a loss at the EBIT level, and saw its revenue drop to ₩111b, which is a fall of 16%. That's not what we would hope to see.
So How Risky Is Pangrim?
While Pangrim lost money on an earnings before interest and tax (EBIT) level, it actually booked a paper profit of ₩774m. So when you consider it has net cash, along with the statutory profit, the stock probably isn't as risky as it might seem, at least in the short term. We'll feel more comfortable with the stock once EBIT is positive, given the lacklustre revenue growth. When analysing debt levels, the balance sheet is the obvious place to start. But ultimately, every company can contain risks that exist outside of the balance sheet. For instance, we've identified 4 warning signs for Pangrim (1 can't be ignored) you should be aware of.
At the end of the day, it's often better to focus on companies that are free from net debt. You can access our special list of such companies (all with a track record of profit growth). It's free.
New: Manage All Your Stock Portfolios in One Place
We've created the ultimate portfolio companion for stock investors, and it's free.
• Connect an unlimited number of Portfolios and see your total in one currency
• Be alerted to new Warning Signs or Risks via email or mobile
• Track the Fair Value of your stocks
Have feedback on this article? Concerned about the content? Get in touch with us directly. Alternatively, email editorial-team (at) simplywallst.com.
This article by Simply Wall St is general in nature. We provide commentary based on historical data and analyst forecasts only using an unbiased methodology and our articles are not intended to be financial advice. It does not constitute a recommendation to buy or sell any stock, and does not take account of your objectives, or your financial situation. We aim to bring you long-term focused analysis driven by fundamental data. Note that our analysis may not factor in the latest price-sensitive company announcements or qualitative material. Simply Wall St has no position in any stocks mentioned.
About KOSE:A003610
Pangrim
Engages in the manufacture and sale of textile products in South Korea and internationally.
Acceptable track record with mediocre balance sheet.
Market Insights

Advertisement
Community Narratives
A formidable player in AI and enterprise computing.
Fair Value US$210.00|3.9% overvalued
CO
Community Contributor
IREN's Bold Moves in Sustainable Bitcoin Mining & AI Data Centers
Fair Value US$89.00|21.8% undervalued
BL
Community Contributor
Cooling the Champions: The Aussie Tech Behind F1's Victories
Fair Value AU$12.40|40.6% undervalued
TR
Community Contributor