
Advertisement
- South Korea
- /
- Machinery
- /
- KOSE:A145210
Dynamic Design Co., LTD.'s (KRX:145210) 37% Price Boost Is Out Of Tune With Revenues
Dynamic Design Co., LTD. (KRX:145210) shareholders are no doubt pleased to see that the share price has bounced 37% in the last month, although it is still struggling to make up recently lost ground. Still, the 30-day jump doesn't change the fact that longer term shareholders have seen their stock decimated by the 73% share price drop in the last twelve months.
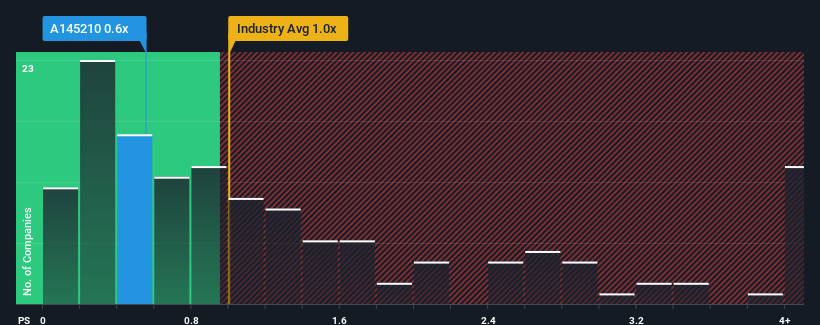
Although its price has surged higher, there still wouldn't be many who think Dynamic Design's price-to-sales (or "P/S") ratio of 0.6x is worth a mention when the median P/S in Korea's Machinery industry is similar at about 1x. Although, it's not wise to simply ignore the P/S without explanation as investors may be disregarding a distinct opportunity or a costly mistake.
Our free stock report includes 4 warning signs investors should be aware of before investing in Dynamic Design. Read for free now.View our latest analysis for Dynamic Design
How Dynamic Design Has Been Performing
Revenue has risen firmly for Dynamic Design recently, which is pleasing to see. It might be that many expect the respectable revenue performance to wane, which has kept the P/S from rising. If you like the company, you'd be hoping this isn't the case so that you could potentially pick up some stock while it's not quite in favour.
Want the full picture on earnings, revenue and cash flow for the company? Then our free report on Dynamic Design will help you shine a light on its historical performance.How Is Dynamic Design's Revenue Growth Trending?
There's an inherent assumption that a company should be matching the industry for P/S ratios like Dynamic Design's to be considered reasonable.
Retrospectively, the last year delivered a decent 9.9% gain to the company's revenues. The solid recent performance means it was also able to grow revenue by 19% in total over the last three years. So we can start by confirming that the company has actually done a good job of growing revenue over that time.
Comparing the recent medium-term revenue trends against the industry's one-year growth forecast of 20% shows it's noticeably less attractive.
With this information, we find it interesting that Dynamic Design is trading at a fairly similar P/S compared to the industry. It seems most investors are ignoring the fairly limited recent growth rates and are willing to pay up for exposure to the stock. Maintaining these prices will be difficult to achieve as a continuation of recent revenue trends is likely to weigh down the shares eventually.
The Final Word
Its shares have lifted substantially and now Dynamic Design's P/S is back within range of the industry median. It's argued the price-to-sales ratio is an inferior measure of value within certain industries, but it can be a powerful business sentiment indicator.
Our examination of Dynamic Design revealed its poor three-year revenue trends aren't resulting in a lower P/S as per our expectations, given they look worse than current industry outlook. Right now we are uncomfortable with the P/S as this revenue performance isn't likely to support a more positive sentiment for long. Unless there is a significant improvement in the company's medium-term performance, it will be difficult to prevent the P/S ratio from declining to a more reasonable level.
We don't want to rain on the parade too much, but we did also find 4 warning signs for Dynamic Design (3 don't sit too well with us!) that you need to be mindful of.
It's important to make sure you look for a great company, not just the first idea you come across. So if growing profitability aligns with your idea of a great company, take a peek at this free list of interesting companies with strong recent earnings growth (and a low P/E).
New: Manage All Your Stock Portfolios in One Place
We've created the ultimate portfolio companion for stock investors, and it's free.
• Connect an unlimited number of Portfolios and see your total in one currency
• Be alerted to new Warning Signs or Risks via email or mobile
• Track the Fair Value of your stocks
Have feedback on this article? Concerned about the content? Get in touch with us directly. Alternatively, email editorial-team (at) simplywallst.com.
This article by Simply Wall St is general in nature. We provide commentary based on historical data and analyst forecasts only using an unbiased methodology and our articles are not intended to be financial advice. It does not constitute a recommendation to buy or sell any stock, and does not take account of your objectives, or your financial situation. We aim to bring you long-term focused analysis driven by fundamental data. Note that our analysis may not factor in the latest price-sensitive company announcements or qualitative material. Simply Wall St has no position in any stocks mentioned.
About KOSE:A145210
Dynamic Design
Primarily engages in the manufacture and sale of tire molds forming machines in Korea, China, the Americas, Europe, and Indonesia.
Mediocre balance sheet with very low risk.
Market Insights

Advertisement
Community Narratives
America Wants Homegrown Drones — Draganfly Is Ready to Deliver
Fair Value US$9.21|32.6% undervalued
JO
Community Contributor
Cheesecake Factory offers an enticing opportunity for long-term growth by leveraging new concepts
Fair Value US$73.83|25.6% undervalued
ZW
Community Contributor
Coca-Cola’s Intrinsic Value Set to Rise with Fed Rate Cut
Fair Value US$67.50|1.6% undervalued
AL
Community Contributor
Fully Permitted Gold Mine with 50 Baggers Potential 
Fair Value CA$41.00|98.2% undervalued
RO
Community Contributor