
Advertisement
- South Korea
- /
- Machinery
- /
- KOSE:A010140
Samsung Heavy Industries Co., Ltd.'s (KRX:010140) 26% Share Price Surge Not Quite Adding Up

Samsung Heavy Industries Co., Ltd. (KRX:010140) shareholders would be excited to see that the share price has had a great month, posting a 26% gain and recovering from prior weakness. Looking back a bit further, it's encouraging to see the stock is up 34% in the last year.
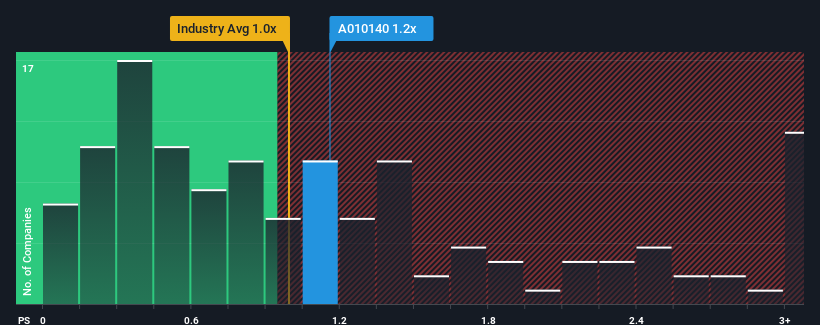
In spite of the firm bounce in price, there still wouldn't be many who think Samsung Heavy Industries' price-to-sales (or "P/S") ratio of 1.2x is worth a mention when the median P/S in Korea's Machinery industry is similar at about 1x. Although, it's not wise to simply ignore the P/S without explanation as investors may be disregarding a distinct opportunity or a costly mistake.
View our latest analysis for Samsung Heavy Industries
What Does Samsung Heavy Industries' P/S Mean For Shareholders?
Recent times have been advantageous for Samsung Heavy Industries as its revenues have been rising faster than most other companies. One possibility is that the P/S ratio is moderate because investors think this strong revenue performance might be about to tail off. If not, then existing shareholders have reason to be feeling optimistic about the future direction of the share price.
Keen to find out how analysts think Samsung Heavy Industries' future stacks up against the industry? In that case, our free report is a great place to start.Do Revenue Forecasts Match The P/S Ratio?
Samsung Heavy Industries' P/S ratio would be typical for a company that's only expected to deliver moderate growth, and importantly, perform in line with the industry.
If we review the last year of revenue growth, the company posted a terrific increase of 44%. The latest three year period has also seen an excellent 32% overall rise in revenue, aided by its short-term performance. So we can start by confirming that the company has done a great job of growing revenue over that time.
Shifting to the future, estimates from the analysts covering the company suggest revenue should grow by 16% over the next year. Meanwhile, the rest of the industry is forecast to expand by 31%, which is noticeably more attractive.
With this information, we find it interesting that Samsung Heavy Industries is trading at a fairly similar P/S compared to the industry. It seems most investors are ignoring the fairly limited growth expectations and are willing to pay up for exposure to the stock. Maintaining these prices will be difficult to achieve as this level of revenue growth is likely to weigh down the shares eventually.
What Does Samsung Heavy Industries' P/S Mean For Investors?
Samsung Heavy Industries appears to be back in favour with a solid price jump bringing its P/S back in line with other companies in the industry We'd say the price-to-sales ratio's power isn't primarily as a valuation instrument but rather to gauge current investor sentiment and future expectations.
Our look at the analysts forecasts of Samsung Heavy Industries' revenue prospects has shown that its inferior revenue outlook isn't negatively impacting its P/S as much as we would have predicted. At present, we aren't confident in the P/S as the predicted future revenues aren't likely to support a more positive sentiment for long. This places shareholders' investments at risk and potential investors in danger of paying an unnecessary premium.
Many other vital risk factors can be found on the company's balance sheet. Our free balance sheet analysis for Samsung Heavy Industries with six simple checks will allow you to discover any risks that could be an issue.
Of course, profitable companies with a history of great earnings growth are generally safer bets. So you may wish to see this free collection of other companies that have reasonable P/E ratios and have grown earnings strongly.
New: Manage All Your Stock Portfolios in One Place
We've created the ultimate portfolio companion for stock investors, and it's free.
• Connect an unlimited number of Portfolios and see your total in one currency
• Be alerted to new Warning Signs or Risks via email or mobile
• Track the Fair Value of your stocks
Have feedback on this article? Concerned about the content? Get in touch with us directly. Alternatively, email editorial-team (at) simplywallst.com.
This article by Simply Wall St is general in nature. We provide commentary based on historical data and analyst forecasts only using an unbiased methodology and our articles are not intended to be financial advice. It does not constitute a recommendation to buy or sell any stock, and does not take account of your objectives, or your financial situation. We aim to bring you long-term focused analysis driven by fundamental data. Note that our analysis may not factor in the latest price-sensitive company announcements or qualitative material. Simply Wall St has no position in any stocks mentioned.
Have feedback on this article? Concerned about the content? Get in touch with us directly. Alternatively, email editorial-team@simplywallst.com
About KOSE:A010140
Samsung Heavy Industries
Engages in the shipbuilding, offshore, and energy and infra businesses worldwide.
Reasonable growth potential and fair value.
Similar Companies
Market Insights


Advertisement
Community Narratives
Nike's Direct-to-Consumer Focus Will Drive Future Growth
Fair Value US$87.90|18.2% undervalued
UN
Community Contributor
Novo Nordisk will dominate GLP-1 market with Ozempic and Wegovy growth
Fair Value US$89.59|12.1% undervalued
BE
Community Contributor
Rheinmetall could get 20-25% of EU-NATO 3%-GDP defence spending
Fair Value €7.57k|82.4% undervalued
NO
Community Contributor