
Advertisement
Howard Marks put it nicely when he said that, rather than worrying about share price volatility, 'The possibility of permanent loss is the risk I worry about... and every practical investor I know worries about.' When we think about how risky a company is, we always like to look at its use of debt, since debt overload can lead to ruin. We note that SIMPAC Inc. (KRX:009160) does have debt on its balance sheet. But the more important question is: how much risk is that debt creating?
Why Does Debt Bring Risk?
Debt and other liabilities become risky for a business when it cannot easily fulfill those obligations, either with free cash flow or by raising capital at an attractive price. In the worst case scenario, a company can go bankrupt if it cannot pay its creditors. However, a more usual (but still expensive) situation is where a company must dilute shareholders at a cheap share price simply to get debt under control. Of course, plenty of companies use debt to fund growth, without any negative consequences. The first thing to do when considering how much debt a business uses is to look at its cash and debt together.
How Much Debt Does SIMPAC Carry?
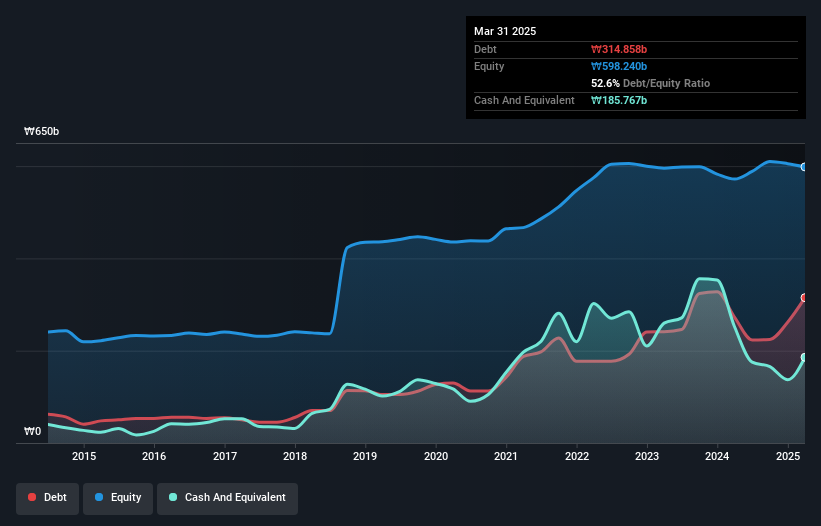
As you can see below, at the end of March 2025, SIMPAC had ₩314.9b of debt, up from ₩272.3b a year ago. Click the image for more detail. However, it also had ₩185.8b in cash, and so its net debt is ₩129.1b.
How Strong Is SIMPAC's Balance Sheet?
Zooming in on the latest balance sheet data, we can see that SIMPAC had liabilities of ₩512.6b due within 12 months and liabilities of ₩36.1b due beyond that. Offsetting these obligations, it had cash of ₩185.8b as well as receivables valued at ₩127.5b due within 12 months. So its liabilities outweigh the sum of its cash and (near-term) receivables by ₩235.5b.
This is a mountain of leverage relative to its market capitalization of ₩258.1b. This suggests shareholders would be heavily diluted if the company needed to shore up its balance sheet in a hurry.
See our latest analysis for SIMPAC
We use two main ratios to inform us about debt levels relative to earnings. The first is net debt divided by earnings before interest, tax, depreciation, and amortization (EBITDA), while the second is how many times its earnings before interest and tax (EBIT) covers its interest expense (or its interest cover, for short). Thus we consider debt relative to earnings both with and without depreciation and amortization expenses.
With net debt to EBITDA of 2.6 SIMPAC has a fairly noticeable amount of debt. On the plus side, its EBIT was 9.8 times its interest expense, and its net debt to EBITDA, was quite high, at 2.6. Pleasingly, SIMPAC is growing its EBIT faster than former Australian PM Bob Hawke downs a yard glass, boasting a 910% gain in the last twelve months. The balance sheet is clearly the area to focus on when you are analysing debt. But it is SIMPAC's earnings that will influence how the balance sheet holds up in the future. So when considering debt, it's definitely worth looking at the earnings trend. Click here for an interactive snapshot.
But our final consideration is also important, because a company cannot pay debt with paper profits; it needs cold hard cash. So the logical step is to look at the proportion of that EBIT that is matched by actual free cash flow. During the last three years, SIMPAC burned a lot of cash. While investors are no doubt expecting a reversal of that situation in due course, it clearly does mean its use of debt is more risky.
Our View
SIMPAC's conversion of EBIT to free cash flow and level of total liabilities definitely weigh on it, in our esteem. But its EBIT growth rate tells a very different story, and suggests some resilience. Taking the abovementioned factors together we do think SIMPAC's debt poses some risks to the business. So while that leverage does boost returns on equity, we wouldn't really want to see it increase from here. When analysing debt levels, the balance sheet is the obvious place to start. However, not all investment risk resides within the balance sheet - far from it. For example SIMPAC has 2 warning signs (and 1 which is a bit concerning) we think you should know about.
Of course, if you're the type of investor who prefers buying stocks without the burden of debt, then don't hesitate to discover our exclusive list of net cash growth stocks, today.
New: Manage All Your Stock Portfolios in One Place
We've created the ultimate portfolio companion for stock investors, and it's free.
• Connect an unlimited number of Portfolios and see your total in one currency
• Be alerted to new Warning Signs or Risks via email or mobile
• Track the Fair Value of your stocks
Have feedback on this article? Concerned about the content? Get in touch with us directly. Alternatively, email editorial-team (at) simplywallst.com.
This article by Simply Wall St is general in nature. We provide commentary based on historical data and analyst forecasts only using an unbiased methodology and our articles are not intended to be financial advice. It does not constitute a recommendation to buy or sell any stock, and does not take account of your objectives, or your financial situation. We aim to bring you long-term focused analysis driven by fundamental data. Note that our analysis may not factor in the latest price-sensitive company announcements or qualitative material. Simply Wall St has no position in any stocks mentioned.
About KOSE:A009160
SIMPAC
Manufactures and markets mechanical, hydraulic, and servo press machines worldwide.
Excellent balance sheet and good value.
Market Insights

Advertisement
Community Narratives
America Wants Homegrown Drones — Draganfly Is Ready to Deliver
Fair Value US$9.21|33.8% undervalued
JO
Community Contributor
Cheesecake Factory offers an enticing opportunity for long-term growth by leveraging new concepts
Fair Value US$73.83|26.3% undervalued
ZW
Community Contributor
Coca-Cola’s Intrinsic Value Set to Rise with Fed Rate Cut
Fair Value US$67.50|1.2% undervalued
AL
Community Contributor
Fully Permitted Gold Mine with 50 Baggers Potential 
Fair Value CA$41.00|98.6% undervalued
RO
Community Contributor