
Advertisement
- South Korea
- /
- Electrical
- /
- KOSDAQ:A340930
Youil Energy Tech Co.,Ltd.'s (KOSDAQ:340930) Popularity With Investors Under Threat As Stock Sinks 28%

Youil Energy Tech Co.,Ltd. (KOSDAQ:340930) shares have retraced a considerable 28% in the last month, reversing a fair amount of their solid recent performance. The drop over the last 30 days has capped off a tough year for shareholders, with the share price down 43% in that time.
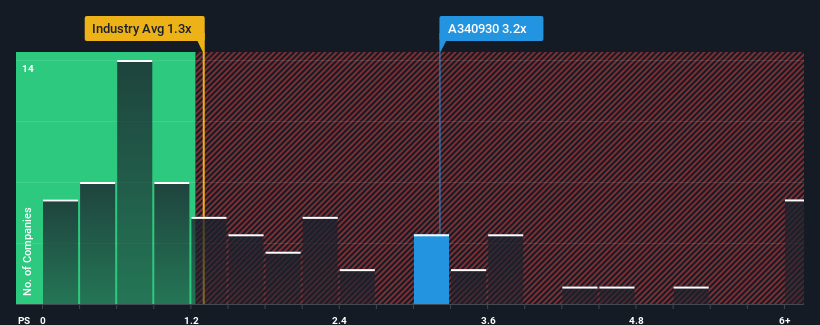
Even after such a large drop in price, you could still be forgiven for thinking Youil Energy TechLtd is a stock not worth researching with a price-to-sales ratios (or "P/S") of 3.2x, considering almost half the companies in Korea's Electrical industry have P/S ratios below 1.3x. However, the P/S might be high for a reason and it requires further investigation to determine if it's justified.
Check out our latest analysis for Youil Energy TechLtd
How Youil Energy TechLtd Has Been Performing
For instance, Youil Energy TechLtd's receding revenue in recent times would have to be some food for thought. Perhaps the market believes the company can do enough to outperform the rest of the industry in the near future, which is keeping the P/S ratio high. However, if this isn't the case, investors might get caught out paying too much for the stock.
We don't have analyst forecasts, but you can see how recent trends are setting up the company for the future by checking out our free report on Youil Energy TechLtd's earnings, revenue and cash flow.What Are Revenue Growth Metrics Telling Us About The High P/S?
Youil Energy TechLtd's P/S ratio would be typical for a company that's expected to deliver solid growth, and importantly, perform better than the industry.
In reviewing the last year of financials, we were disheartened to see the company's revenues fell to the tune of 19%. The last three years don't look nice either as the company has shrunk revenue by 35% in aggregate. Therefore, it's fair to say the revenue growth recently has been undesirable for the company.
This is in contrast to the rest of the industry, which is expected to decline by 6.3% over the next year, or less than the company's recent medium-term annualised revenue decline.
In light of this, it's odd that Youil Energy TechLtd's P/S sits above the majority of other companies. With revenue going quickly in reverse, it's not guaranteed that the P/S has found a floor yet. There's potential for the P/S to fall to lower levels if the company doesn't improve its top-line growth, which would be difficult to do with the current industry outlook.
What Does Youil Energy TechLtd's P/S Mean For Investors?
Youil Energy TechLtd's P/S remain high even after its stock plunged. It's argued the price-to-sales ratio is an inferior measure of value within certain industries, but it can be a powerful business sentiment indicator.
Our examination of Youil Energy TechLtd revealed its sharp three-year contraction in revenue isn't impacting its high P/S anywhere near as much as we would have predicted, given the industry is set to shrink less severely. Right now we aren't comfortable with the high P/S as this revenue performance is unlikely to support such positive sentiment for long. In addition, we would be concerned whether the company can even maintain its medium-term level of performance under these tough industry conditions. Unless the company's relative performance improves markedly, it's very challenging to accept these prices as being reasonable.
You need to take note of risks, for example - Youil Energy TechLtd has 5 warning signs (and 3 which are potentially serious) we think you should know about.
If companies with solid past earnings growth is up your alley, you may wish to see this free collection of other companies with strong earnings growth and low P/E ratios.
New: Manage All Your Stock Portfolios in One Place
We've created the ultimate portfolio companion for stock investors, and it's free.
• Connect an unlimited number of Portfolios and see your total in one currency
• Be alerted to new Warning Signs or Risks via email or mobile
• Track the Fair Value of your stocks
Have feedback on this article? Concerned about the content? Get in touch with us directly. Alternatively, email editorial-team (at) simplywallst.com.
This article by Simply Wall St is general in nature. We provide commentary based on historical data and analyst forecasts only using an unbiased methodology and our articles are not intended to be financial advice. It does not constitute a recommendation to buy or sell any stock, and does not take account of your objectives, or your financial situation. We aim to bring you long-term focused analysis driven by fundamental data. Note that our analysis may not factor in the latest price-sensitive company announcements or qualitative material. Simply Wall St has no position in any stocks mentioned.
About KOSDAQ:A340930
Youil Energy TechLtd
Youil Energy Technology Co.,Ltd manufactures secondary batteries and fuel cells in South Korea.
Slight and slightly overvalued.
Market Insights

Advertisement
Community Narratives

Apple: A Dying Star with an Overpriced Valuation
Fair Value US$177.34|19.1% overvalued
IN
Community Contributor
Avino a case for USD$20 per share within 5 years (assuming $3,500 gold, $100 silver and $4 copper).
Fair Value CA$26.79|86.0% undervalued
AG
Community Contributor
Riding the Defense Boom RENK Sees Revenue Climb at 15% CAGR by FY 2029
Fair Value €69.87|14.3% undervalued
CH
Community Contributor