- South Korea
- /
- Electrical
- /
- KOSDAQ:A119850
Investors Interested In GnCenergy Co., Ltd's (KOSDAQ:119850) Earnings

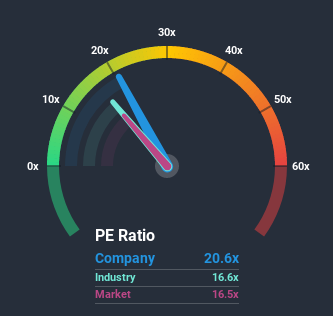
With a price-to-earnings (or "P/E") ratio of 20.6x GnCenergy Co., Ltd (KOSDAQ:119850) may be sending bearish signals at the moment, given that almost half of all companies in Korea have P/E ratios under 16x and even P/E's lower than 9x are not unusual. However, the P/E might be high for a reason and it requires further investigation to determine if it's justified.
GnCenergy could be doing better as its earnings have been going backwards lately while most other companies have been seeing positive earnings growth. One possibility is that the P/E is high because investors think this poor earnings performance will turn the corner. If not, then existing shareholders may be extremely nervous about the viability of the share price.
View our latest analysis for GnCenergy
Where Does GnCenergy's P/E Sit Within Its Industry?
It's plausible that GnCenergy's high P/E ratio could be a result of tendencies within its own industry. It turns out the Electrical industry in general has a P/E ratio similar to the market, as the graphic below shows. So it appears the company's ratio isn't really influenced by these industry numbers currently. In the context of the Electrical industry's current setting, most of its constituents' P/E's would be expected to be held back. Nevertheless, the company's P/E should be primarily influenced by its own financial performance.

Is There Enough Growth For GnCenergy?
In order to justify its P/E ratio, GnCenergy would need to produce impressive growth in excess of the market.
If we review the last year of earnings, dishearteningly the company's profits fell to the tune of 11%. As a result, earnings from three years ago have also fallen 33% overall. So unfortunately, we have to acknowledge that the company has not done a great job of growing earnings over that time.
Shifting to the future, estimates from the two analysts covering the company suggest earnings should grow by 37% per year over the next three years. Meanwhile, the rest of the market is forecast to only expand by 23% per annum, which is noticeably less attractive.
With this information, we can see why GnCenergy is trading at such a high P/E compared to the market. Apparently shareholders aren't keen to offload something that is potentially eyeing a more prosperous future.
The Bottom Line On GnCenergy's P/E
Generally, our preference is to limit the use of the price-to-earnings ratio to establishing what the market thinks about the overall health of a company.
As we suspected, our examination of GnCenergy's analyst forecasts revealed that its superior earnings outlook is contributing to its high P/E. At this stage investors feel the potential for a deterioration in earnings isn't great enough to justify a lower P/E ratio. Unless these conditions change, they will continue to provide strong support to the share price.
You need to take note of risks, for example - GnCenergy has 4 warning signs (and 1 which can't be ignored) we think you should know about.
You might be able to find a better investment than GnCenergy. If you want a selection of possible candidates, check out this free list of interesting companies that trade on a P/E below 20x (but have proven they can grow earnings).
If you’re looking to trade GnCenergy, open an account with the lowest-cost* platform trusted by professionals, Interactive Brokers. Their clients from over 200 countries and territories trade stocks, options, futures, forex, bonds and funds worldwide from a single integrated account. Promoted
New: Manage All Your Stock Portfolios in One Place
We've created the ultimate portfolio companion for stock investors, and it's free.
• Connect an unlimited number of Portfolios and see your total in one currency
• Be alerted to new Warning Signs or Risks via email or mobile
• Track the Fair Value of your stocks
This article by Simply Wall St is general in nature. It does not constitute a recommendation to buy or sell any stock, and does not take account of your objectives, or your financial situation. We aim to bring you long-term focused analysis driven by fundamental data. Note that our analysis may not factor in the latest price-sensitive company announcements or qualitative material. Simply Wall St has no position in any stocks mentioned.
*Interactive Brokers Rated Lowest Cost Broker by StockBrokers.com Annual Online Review 2020
Have feedback on this article? Concerned about the content? Get in touch with us directly. Alternatively, email editorial-team@simplywallst.com.
About KOSDAQ:A119850
GnCenergy
Engages in the manufacture and sale of power generators in Korea.
Outstanding track record with flawless balance sheet.
Market Insights
Community Narratives


