
Advertisement
If we want to find a potential multi-bagger, often there are underlying trends that can provide clues. Firstly, we'll want to see a proven return on capital employed (ROCE) that is increasing, and secondly, an expanding base of capital employed. If you see this, it typically means it's a company with a great business model and plenty of profitable reinvestment opportunities. With that in mind, we've noticed some promising trends at CNPLUS (KOSDAQ:115530) so let's look a bit deeper.
Understanding Return On Capital Employed (ROCE)
For those who don't know, ROCE is a measure of a company's yearly pre-tax profit (its return), relative to the capital employed in the business. The formula for this calculation on CNPLUS is:
Return on Capital Employed = Earnings Before Interest and Tax (EBIT) ÷ (Total Assets - Current Liabilities)
0.069 = ₩961m ÷ (₩34b - ₩20b) (Based on the trailing twelve months to December 2023).
Thus, CNPLUS has an ROCE of 6.9%. In absolute terms, that's a low return but it's around the Electrical industry average of 8.3%.
Check out our latest analysis for CNPLUS
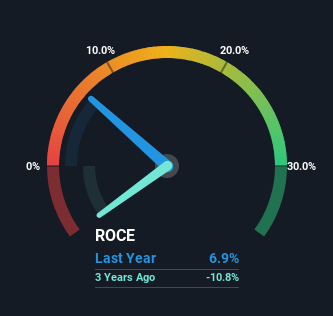
Historical performance is a great place to start when researching a stock so above you can see the gauge for CNPLUS' ROCE against it's prior returns. If you'd like to look at how CNPLUS has performed in the past in other metrics, you can view this free graph of CNPLUS' past earnings, revenue and cash flow.
So How Is CNPLUS' ROCE Trending?
We're delighted to see that CNPLUS is reaping rewards from its investments and has now broken into profitability. While the business is profitable now, it used to be incurring losses on invested capital five years ago. Additionally, the business is utilizing 21% less capital than it was five years ago, and taken at face value, that can mean the company needs less funds at work to get a return. The reduction could indicate that the company is selling some assets, and considering returns are up, they appear to be selling the right ones.
Another thing to note, CNPLUS has a high ratio of current liabilities to total assets of 59%. This can bring about some risks because the company is basically operating with a rather large reliance on its suppliers or other sorts of short-term creditors. While it's not necessarily a bad thing, it can be beneficial if this ratio is lower.
Our Take On CNPLUS' ROCE
From what we've seen above, CNPLUS has managed to increase it's returns on capital all the while reducing it's capital base. Given the stock has declined 28% in the last year, this could be a good investment if the valuation and other metrics are also appealing. That being the case, research into the company's current valuation metrics and future prospects seems fitting.
Since virtually every company faces some risks, it's worth knowing what they are, and we've spotted 5 warning signs for CNPLUS (of which 3 are significant!) that you should know about.
While CNPLUS may not currently earn the highest returns, we've compiled a list of companies that currently earn more than 25% return on equity. Check out this free list here.
New: AI Stock Screener & Alerts
Our new AI Stock Screener scans the market every day to uncover opportunities.
• Dividend Powerhouses (3%+ Yield)
• Undervalued Small Caps with Insider Buying
• High growth Tech and AI Companies
Or build your own from over 50 metrics.
Have feedback on this article? Concerned about the content? Get in touch with us directly. Alternatively, email editorial-team (at) simplywallst.com.
This article by Simply Wall St is general in nature. We provide commentary based on historical data and analyst forecasts only using an unbiased methodology and our articles are not intended to be financial advice. It does not constitute a recommendation to buy or sell any stock, and does not take account of your objectives, or your financial situation. We aim to bring you long-term focused analysis driven by fundamental data. Note that our analysis may not factor in the latest price-sensitive company announcements or qualitative material. Simply Wall St has no position in any stocks mentioned.
About KOSDAQ:A115530
Mediocre balance sheet and slightly overvalued.
Market Insights

Advertisement
Community Narratives
Quality at a Premium. A time to watch, not to buy?
Fair Value US$154.56|29.3% undervalued
DA
Community Contributor
GRAB: The Super-App at the Heart of Southeast Asia’s Digital Boom
Fair Value US$6.60|7.0% undervalued
BL
Community Contributor
Verve Group to Surge with 51.61% Revenue Growth
Fair Value €6.00|65.0% undervalued
ME
Community Contributor