
Advertisement
- South Korea
- /
- Machinery
- /
- KOSDAQ:A064820
We Think You Should Be Aware Of Some Concerning Factors In Cape Industries' (KOSDAQ:064820) Earnings

Cape Industries Ltd. (KOSDAQ:064820) just released a solid earnings report, and the stock displayed some strength. Despite this, our analysis suggests that there are some factors weakening the foundations of those good profit numbers.
View our latest analysis for Cape Industries
A Closer Look At Cape Industries' Earnings
One key financial ratio used to measure how well a company converts its profit to free cash flow (FCF) is the accrual ratio. To get the accrual ratio we first subtract FCF from profit for a period, and then divide that number by the average operating assets for the period. The ratio shows us how much a company's profit exceeds its FCF.
That means a negative accrual ratio is a good thing, because it shows that the company is bringing in more free cash flow than its profit would suggest. While it's not a problem to have a positive accrual ratio, indicating a certain level of non-cash profits, a high accrual ratio is arguably a bad thing, because it indicates paper profits are not matched by cash flow. That's because some academic studies have suggested that high accruals ratios tend to lead to lower profit or less profit growth.
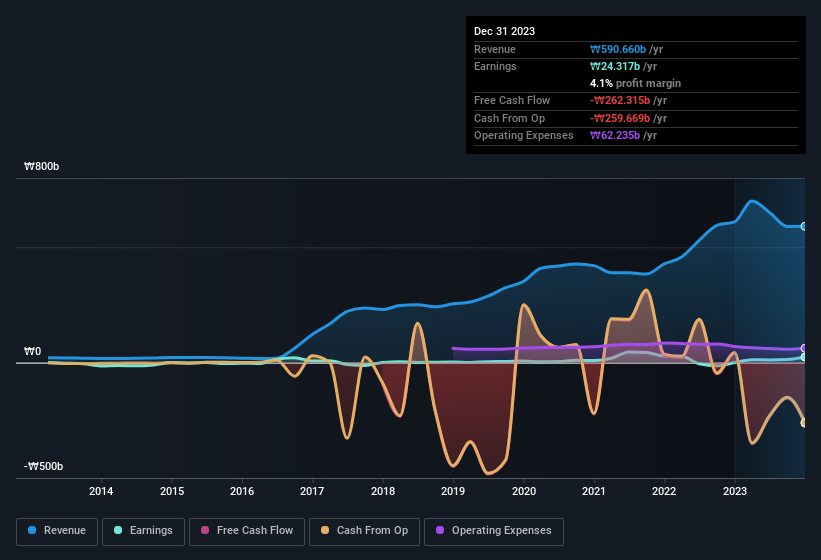
For the year to December 2023, Cape Industries had an accrual ratio of 0.76. Statistically speaking, that's a real negative for future earnings. To wit, the company did not generate one whit of free cashflow in that time. Over the last year it actually had negative free cash flow of ₩262b, in contrast to the aforementioned profit of ₩24.3b. It's worth noting that Cape Industries generated positive FCF of ₩41b a year ago, so at least they've done it in the past. The good news for shareholders is that Cape Industries' accrual ratio was much better last year, so this year's poor reading might simply be a case of a short term mismatch between profit and FCF. As a result, some shareholders may be looking for stronger cash conversion in the current year.
Note: we always recommend investors check balance sheet strength. Click here to be taken to our balance sheet analysis of Cape Industries.
Our Take On Cape Industries' Profit Performance
As we have made quite clear, we're a bit worried that Cape Industries didn't back up the last year's profit with free cashflow. As a result, we think it may well be the case that Cape Industries' underlying earnings power is lower than its statutory profit. But the good news is that its EPS growth over the last three years has been very impressive. Of course, we've only just scratched the surface when it comes to analysing its earnings; one could also consider margins, forecast growth, and return on investment, among other factors. In light of this, if you'd like to do more analysis on the company, it's vital to be informed of the risks involved. When we did our research, we found 3 warning signs for Cape Industries (2 can't be ignored!) that we believe deserve your full attention.
This note has only looked at a single factor that sheds light on the nature of Cape Industries' profit. But there are plenty of other ways to inform your opinion of a company. For example, many people consider a high return on equity as an indication of favorable business economics, while others like to 'follow the money' and search out stocks that insiders are buying. While it might take a little research on your behalf, you may find this free collection of companies boasting high return on equity, or this list of stocks that insiders are buying to be useful.
New: AI Stock Screener & Alerts
Our new AI Stock Screener scans the market every day to uncover opportunities.
• Dividend Powerhouses (3%+ Yield)
• Undervalued Small Caps with Insider Buying
• High growth Tech and AI Companies
Or build your own from over 50 metrics.
Have feedback on this article? Concerned about the content? Get in touch with us directly. Alternatively, email editorial-team (at) simplywallst.com.
This article by Simply Wall St is general in nature. We provide commentary based on historical data and analyst forecasts only using an unbiased methodology and our articles are not intended to be financial advice. It does not constitute a recommendation to buy or sell any stock, and does not take account of your objectives, or your financial situation. We aim to bring you long-term focused analysis driven by fundamental data. Note that our analysis may not factor in the latest price-sensitive company announcements or qualitative material. Simply Wall St has no position in any stocks mentioned.
About KOSDAQ:A064820
Cape Industries
Engages in the manufacture and sale of cylinder liners for ships in South Korea and internationally.
Slight and slightly overvalued.
Market Insights


Advertisement
Community Narratives
Suncorp’s Next Chapter: Insurance-Only and Ready to Grow
Fair Value AU$22.83|4.9% undervalued
RO
Community Contributor
Thyssenkrupp Nucera Will Achieve Double-Digit Profits by 2030 Boosted by Hydrogen Growth
Fair Value €14.40|32.5% undervalued
CH
Community Contributor
Tesla’s Nvidia Moment – The AI & Robotics Inflection Point
Fair Value US$384.84|21.9% undervalued
BL
Community Contributor