- South Korea
- /
- Machinery
- /
- KOSDAQ:A053160
Subdued Growth No Barrier To FreeMs Corporation (KOSDAQ:053160) With Shares Advancing 26%


Despite an already strong run, FreeMs Corporation (KOSDAQ:053160) shares have been powering on, with a gain of 26% in the last thirty days. The last month tops off a massive increase of 164% in the last year.
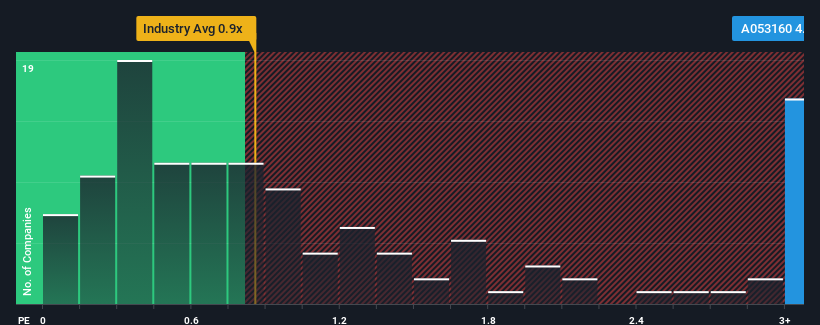
Following the firm bounce in price, when almost half of the companies in Korea's Machinery industry have price-to-sales ratios (or "P/S") below 0.9x, you may consider FreeMs as a stock not worth researching with its 4.1x P/S ratio. Nonetheless, we'd need to dig a little deeper to determine if there is a rational basis for the highly elevated P/S.
View our latest analysis for FreeMs
What Does FreeMs' P/S Mean For Shareholders?
For instance, FreeMs' receding revenue in recent times would have to be some food for thought. Perhaps the market believes the company can do enough to outperform the rest of the industry in the near future, which is keeping the P/S ratio high. If not, then existing shareholders may be quite nervous about the viability of the share price.
Want the full picture on earnings, revenue and cash flow for the company? Then our free report on FreeMs will help you shine a light on its historical performance.How Is FreeMs' Revenue Growth Trending?
FreeMs' P/S ratio would be typical for a company that's expected to deliver very strong growth, and importantly, perform much better than the industry.
Taking a look back first, the company's revenue growth last year wasn't something to get excited about as it posted a disappointing decline of 13%. However, a few very strong years before that means that it was still able to grow revenue by an impressive 51% in total over the last three years. Although it's been a bumpy ride, it's still fair to say the revenue growth recently has been more than adequate for the company.
Comparing that to the industry, which is predicted to deliver 32% growth in the next 12 months, the company's momentum is weaker, based on recent medium-term annualised revenue results.
With this information, we find it concerning that FreeMs is trading at a P/S higher than the industry. Apparently many investors in the company are way more bullish than recent times would indicate and aren't willing to let go of their stock at any price. Only the boldest would assume these prices are sustainable as a continuation of recent revenue trends is likely to weigh heavily on the share price eventually.
The Key Takeaway
The strong share price surge has lead to FreeMs' P/S soaring as well. Generally, our preference is to limit the use of the price-to-sales ratio to establishing what the market thinks about the overall health of a company.
The fact that FreeMs currently trades on a higher P/S relative to the industry is an oddity, since its recent three-year growth is lower than the wider industry forecast. Right now we aren't comfortable with the high P/S as this revenue performance isn't likely to support such positive sentiment for long. Unless there is a significant improvement in the company's medium-term performance, it will be difficult to prevent the P/S ratio from declining to a more reasonable level.
There are also other vital risk factors to consider before investing and we've discovered 2 warning signs for FreeMs that you should be aware of.
If you're unsure about the strength of FreeMs' business, why not explore our interactive list of stocks with solid business fundamentals for some other companies you may have missed.
New: AI Stock Screener & Alerts
Our new AI Stock Screener scans the market every day to uncover opportunities.
• Dividend Powerhouses (3%+ Yield)
• Undervalued Small Caps with Insider Buying
• High growth Tech and AI Companies
Or build your own from over 50 metrics.
Have feedback on this article? Concerned about the content? Get in touch with us directly. Alternatively, email editorial-team (at) simplywallst.com.
This article by Simply Wall St is general in nature. We provide commentary based on historical data and analyst forecasts only using an unbiased methodology and our articles are not intended to be financial advice. It does not constitute a recommendation to buy or sell any stock, and does not take account of your objectives, or your financial situation. We aim to bring you long-term focused analysis driven by fundamental data. Note that our analysis may not factor in the latest price-sensitive company announcements or qualitative material. Simply Wall St has no position in any stocks mentioned.
About KOSDAQ:A053160
FreeMs
Manufactures and sells heavy construction equipment in South Korea and internationally.
Mediocre balance sheet low.
Market Insights

Community Narratives
