- South Korea
- /
- Machinery
- /
- KOSDAQ:A053160
FreeMs Corporation's (KOSDAQ:053160) Shares Climb 25% But Its Business Is Yet to Catch Up


FreeMs Corporation (KOSDAQ:053160) shares have had a really impressive month, gaining 25% after a shaky period beforehand. Looking further back, the 22% rise over the last twelve months isn't too bad notwithstanding the strength over the last 30 days.
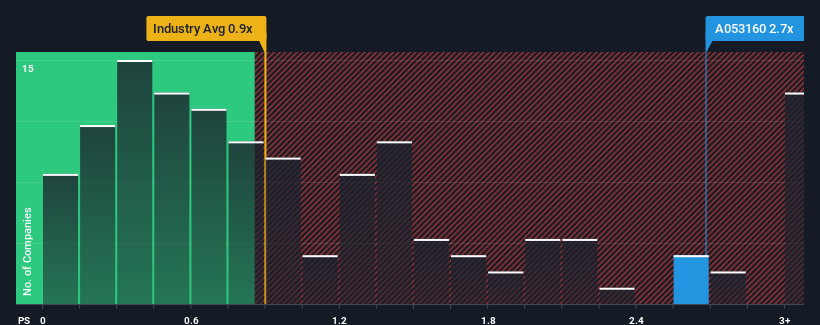
Since its price has surged higher, given close to half the companies operating in Korea's Machinery industry have price-to-sales ratios (or "P/S") below 0.9x, you may consider FreeMs as a stock to potentially avoid with its 2.7x P/S ratio. Nonetheless, we'd need to dig a little deeper to determine if there is a rational basis for the elevated P/S.
See our latest analysis for FreeMs
What Does FreeMs' P/S Mean For Shareholders?
As an illustration, revenue has deteriorated at FreeMs over the last year, which is not ideal at all. Perhaps the market believes the company can do enough to outperform the rest of the industry in the near future, which is keeping the P/S ratio high. If not, then existing shareholders may be quite nervous about the viability of the share price.
We don't have analyst forecasts, but you can see how recent trends are setting up the company for the future by checking out our free report on FreeMs' earnings, revenue and cash flow.Is There Enough Revenue Growth Forecasted For FreeMs?
The only time you'd be truly comfortable seeing a P/S as high as FreeMs' is when the company's growth is on track to outshine the industry.
In reviewing the last year of financials, we were disheartened to see the company's revenues fell to the tune of 29%. This means it has also seen a slide in revenue over the longer-term as revenue is down 3.2% in total over the last three years. So unfortunately, we have to acknowledge that the company has not done a great job of growing revenue over that time.
Comparing that to the industry, which is predicted to deliver 37% growth in the next 12 months, the company's downward momentum based on recent medium-term revenue results is a sobering picture.
With this information, we find it concerning that FreeMs is trading at a P/S higher than the industry. Apparently many investors in the company are way more bullish than recent times would indicate and aren't willing to let go of their stock at any price. There's a very good chance existing shareholders are setting themselves up for future disappointment if the P/S falls to levels more in line with the recent negative growth rates.
What Does FreeMs' P/S Mean For Investors?
FreeMs' P/S is on the rise since its shares have risen strongly. Typically, we'd caution against reading too much into price-to-sales ratios when settling on investment decisions, though it can reveal plenty about what other market participants think about the company.
We've established that FreeMs currently trades on a much higher than expected P/S since its recent revenues have been in decline over the medium-term. When we see revenue heading backwards and underperforming the industry forecasts, we feel the possibility of the share price declining is very real, bringing the P/S back into the realm of reasonability. Unless the the circumstances surrounding the recent medium-term improve, it wouldn't be wrong to expect a a difficult period ahead for the company's shareholders.
We don't want to rain on the parade too much, but we did also find 1 warning sign for FreeMs that you need to be mindful of.
It's important to make sure you look for a great company, not just the first idea you come across. So if growing profitability aligns with your idea of a great company, take a peek at this free list of interesting companies with strong recent earnings growth (and a low P/E).
New: AI Stock Screener & Alerts
Our new AI Stock Screener scans the market every day to uncover opportunities.
• Dividend Powerhouses (3%+ Yield)
• Undervalued Small Caps with Insider Buying
• High growth Tech and AI Companies
Or build your own from over 50 metrics.
Have feedback on this article? Concerned about the content? Get in touch with us directly. Alternatively, email editorial-team (at) simplywallst.com.
This article by Simply Wall St is general in nature. We provide commentary based on historical data and analyst forecasts only using an unbiased methodology and our articles are not intended to be financial advice. It does not constitute a recommendation to buy or sell any stock, and does not take account of your objectives, or your financial situation. We aim to bring you long-term focused analysis driven by fundamental data. Note that our analysis may not factor in the latest price-sensitive company announcements or qualitative material. Simply Wall St has no position in any stocks mentioned.
About KOSDAQ:A053160
FreeMs
Manufactures and sells heavy construction equipment in South Korea and internationally.
Mediocre balance sheet low.
