
Advertisement
- South Korea
- /
- Building
- /
- KOSDAQ:A018310
Further Upside For Sammok S-Form Co.,Ltd (KOSDAQ:018310) Shares Could Introduce Price Risks After 30% Bounce

Sammok S-Form Co.,Ltd (KOSDAQ:018310) shares have continued their recent momentum with a 30% gain in the last month alone. The last 30 days bring the annual gain to a very sharp 61%.
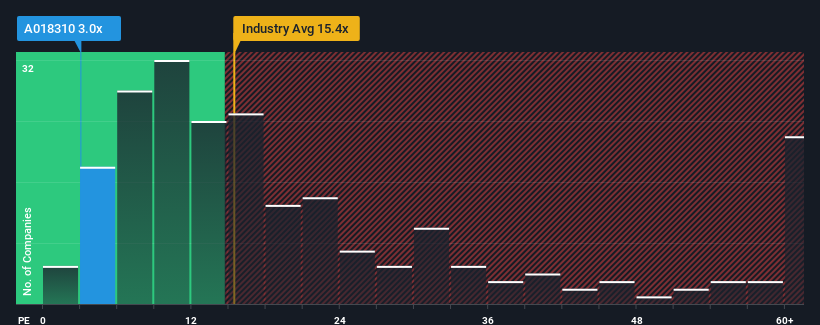
In spite of the firm bounce in price, Sammok S-FormLtd's price-to-earnings (or "P/E") ratio of 3x might still make it look like a strong buy right now compared to the market in Korea, where around half of the companies have P/E ratios above 12x and even P/E's above 23x are quite common. Although, it's not wise to just take the P/E at face value as there may be an explanation why it's so limited.
With earnings growth that's exceedingly strong of late, Sammok S-FormLtd has been doing very well. One possibility is that the P/E is low because investors think this strong earnings growth might actually underperform the broader market in the near future. If that doesn't eventuate, then existing shareholders have reason to be quite optimistic about the future direction of the share price.
Check out our latest analysis for Sammok S-FormLtd
How Is Sammok S-FormLtd's Growth Trending?
In order to justify its P/E ratio, Sammok S-FormLtd would need to produce anemic growth that's substantially trailing the market.
Retrospectively, the last year delivered an exceptional 67% gain to the company's bottom line. Pleasingly, EPS has also lifted 1,345% in aggregate from three years ago, thanks to the last 12 months of growth. Accordingly, shareholders would have probably welcomed those medium-term rates of earnings growth.
Comparing that to the market, which is only predicted to deliver 33% growth in the next 12 months, the company's momentum is stronger based on recent medium-term annualised earnings results.
In light of this, it's peculiar that Sammok S-FormLtd's P/E sits below the majority of other companies. Apparently some shareholders believe the recent performance has exceeded its limits and have been accepting significantly lower selling prices.
The Key Takeaway
Even after such a strong price move, Sammok S-FormLtd's P/E still trails the rest of the market significantly. While the price-to-earnings ratio shouldn't be the defining factor in whether you buy a stock or not, it's quite a capable barometer of earnings expectations.
Our examination of Sammok S-FormLtd revealed its three-year earnings trends aren't contributing to its P/E anywhere near as much as we would have predicted, given they look better than current market expectations. When we see strong earnings with faster-than-market growth, we assume potential risks are what might be placing significant pressure on the P/E ratio. It appears many are indeed anticipating earnings instability, because the persistence of these recent medium-term conditions would normally provide a boost to the share price.
The company's balance sheet is another key area for risk analysis. Our free balance sheet analysis for Sammok S-FormLtd with six simple checks will allow you to discover any risks that could be an issue.
Of course, you might also be able to find a better stock than Sammok S-FormLtd. So you may wish to see this free collection of other companies that have reasonable P/E ratios and have grown earnings strongly.
New: Manage All Your Stock Portfolios in One Place
We've created the ultimate portfolio companion for stock investors, and it's free.
• Connect an unlimited number of Portfolios and see your total in one currency
• Be alerted to new Warning Signs or Risks via email or mobile
• Track the Fair Value of your stocks
Have feedback on this article? Concerned about the content? Get in touch with us directly. Alternatively, email editorial-team (at) simplywallst.com.
This article by Simply Wall St is general in nature. We provide commentary based on historical data and analyst forecasts only using an unbiased methodology and our articles are not intended to be financial advice. It does not constitute a recommendation to buy or sell any stock, and does not take account of your objectives, or your financial situation. We aim to bring you long-term focused analysis driven by fundamental data. Note that our analysis may not factor in the latest price-sensitive company announcements or qualitative material. Simply Wall St has no position in any stocks mentioned.
About KOSDAQ:A018310
Sammok S-FormLtd
Engages in the manufactures, sells, and leases formwork for construction and civil engineering works in South Korea and internationally.
Excellent balance sheet and good value.
Market Insights

Advertisement
Community Narratives
Pole position to benefit from GENIUS Act
Fair Value US$233.04|58.8% undervalued
CH
Community Contributor
IREN will transform from bitcoin miner to leader in AI infrastructure
Fair Value US$21.48|11.6% undervalued
KA
Community Contributor
Behind the Assay: XRF Scientific’s Role in Modern Mining Economics
Fair Value AU$2.10|1.4% undervalued
RO
Community Contributor