- South Korea
- /
- Auto Components
- /
- KOSDAQ:A900260
Rothwell International's (KOSDAQ:900260) Returns On Capital Not Reflecting Well On The Business


To avoid investing in a business that's in decline, there's a few financial metrics that can provide early indications of aging. A business that's potentially in decline often shows two trends, a return on capital employed (ROCE) that's declining, and a base of capital employed that's also declining. Ultimately this means that the company is earning less per dollar invested and on top of that, it's shrinking its base of capital employed. On that note, looking into Rothwell International (KOSDAQ:900260), we weren't too upbeat about how things were going.
Understanding Return On Capital Employed (ROCE)
If you haven't worked with ROCE before, it measures the 'return' (pre-tax profit) a company generates from capital employed in its business. To calculate this metric for Rothwell International, this is the formula:
Return on Capital Employed = Earnings Before Interest and Tax (EBIT) ÷ (Total Assets - Current Liabilities)
0.021 = ₩5.1b ÷ (₩402b - ₩161b) (Based on the trailing twelve months to September 2023).
Thus, Rothwell International has an ROCE of 2.1%. In absolute terms, that's a low return and it also under-performs the Auto Components industry average of 9.0%.
Check out our latest analysis for Rothwell International
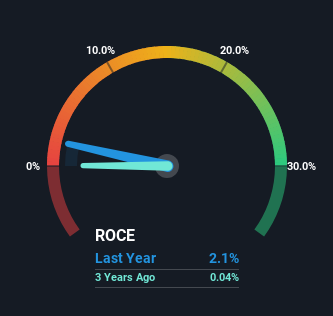
Historical performance is a great place to start when researching a stock so above you can see the gauge for Rothwell International's ROCE against it's prior returns. If you want to delve into the historical earnings , check out these free graphs detailing revenue and cash flow performance of Rothwell International.
What Can We Tell From Rothwell International's ROCE Trend?
We are a bit worried about the trend of returns on capital at Rothwell International. About five years ago, returns on capital were 13%, however they're now substantially lower than that as we saw above. Meanwhile, capital employed in the business has stayed roughly the flat over the period. This combination can be indicative of a mature business that still has areas to deploy capital, but the returns received aren't as high due potentially to new competition or smaller margins. So because these trends aren't typically conducive to creating a multi-bagger, we wouldn't hold our breath on Rothwell International becoming one if things continue as they have.
While on the subject, we noticed that the ratio of current liabilities to total assets has risen to 40%, which has impacted the ROCE. If current liabilities hadn't increased as much as they did, the ROCE could actually be even lower. What this means is that in reality, a rather large portion of the business is being funded by the likes of the company's suppliers or short-term creditors, which can bring some risks of its own.
The Key Takeaway
In the end, the trend of lower returns on the same amount of capital isn't typically an indication that we're looking at a growth stock. We expect this has contributed to the stock plummeting 88% during the last five years. Unless there is a shift to a more positive trajectory in these metrics, we would look elsewhere.
On a separate note, we've found 1 warning sign for Rothwell International you'll probably want to know about.
While Rothwell International isn't earning the highest return, check out this free list of companies that are earning high returns on equity with solid balance sheets.
New: AI Stock Screener & Alerts
Our new AI Stock Screener scans the market every day to uncover opportunities.
• Dividend Powerhouses (3%+ Yield)
• Undervalued Small Caps with Insider Buying
• High growth Tech and AI Companies
Or build your own from over 50 metrics.
Have feedback on this article? Concerned about the content? Get in touch with us directly. Alternatively, email editorial-team (at) simplywallst.com.
This article by Simply Wall St is general in nature. We provide commentary based on historical data and analyst forecasts only using an unbiased methodology and our articles are not intended to be financial advice. It does not constitute a recommendation to buy or sell any stock, and does not take account of your objectives, or your financial situation. We aim to bring you long-term focused analysis driven by fundamental data. Note that our analysis may not factor in the latest price-sensitive company announcements or qualitative material. Simply Wall St has no position in any stocks mentioned.
About KOSDAQ:A900260
Rothwell International
Engages in the research, development, manufacturing, and sales of automotive electronics and electrical products in South Korea.
Solid track record with excellent balance sheet.
Market Insights

Community Narratives
