
Legendary fund manager Li Lu (who Charlie Munger backed) once said, 'The biggest investment risk is not the volatility of prices, but whether you will suffer a permanent loss of capital.' When we think about how risky a company is, we always like to look at its use of debt, since debt overload can lead to ruin. We note that TPC Co., Ltd. (KOSDAQ:130740) does have debt on its balance sheet. But is this debt a concern to shareholders?
When Is Debt A Problem?
Debt assists a business until the business has trouble paying it off, either with new capital or with free cash flow. In the worst case scenario, a company can go bankrupt if it cannot pay its creditors. However, a more common (but still painful) scenario is that it has to raise new equity capital at a low price, thus permanently diluting shareholders. Having said that, the most common situation is where a company manages its debt reasonably well - and to its own advantage. When we examine debt levels, we first consider both cash and debt levels, together.
See our latest analysis for TPC
What Is TPC's Debt?
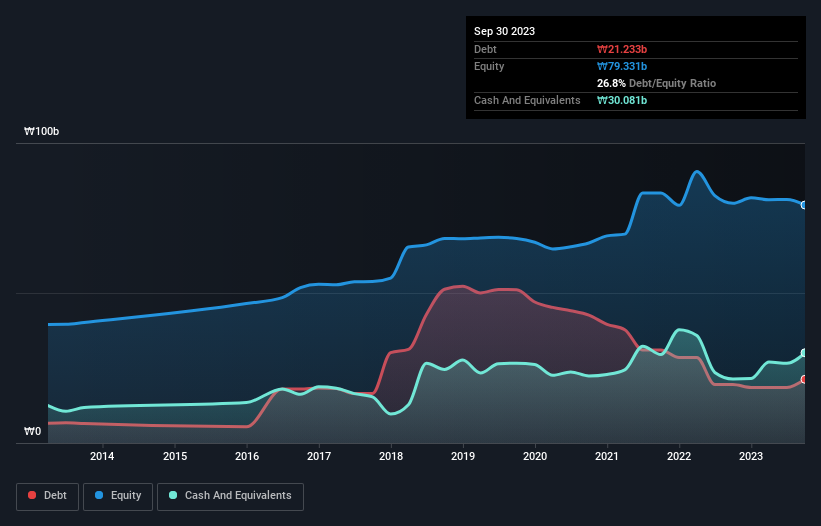
You can click the graphic below for the historical numbers, but it shows that as of September 2023 TPC had ₩21.2b of debt, an increase on ₩19.5b, over one year. However, its balance sheet shows it holds ₩30.1b in cash, so it actually has ₩8.85b net cash.
How Healthy Is TPC's Balance Sheet?
According to the last reported balance sheet, TPC had liabilities of ₩32.6b due within 12 months, and liabilities of ₩9.38b due beyond 12 months. Offsetting this, it had ₩30.1b in cash and ₩14.6b in receivables that were due within 12 months. So it actually has ₩2.73b more liquid assets than total liabilities.
This short term liquidity is a sign that TPC could probably pay off its debt with ease, as its balance sheet is far from stretched. Succinctly put, TPC boasts net cash, so it's fair to say it does not have a heavy debt load! The balance sheet is clearly the area to focus on when you are analysing debt. But it is TPC's earnings that will influence how the balance sheet holds up in the future. So if you're keen to discover more about its earnings, it might be worth checking out this graph of its long term earnings trend.
Over 12 months, TPC made a loss at the EBIT level, and saw its revenue drop to ₩78b, which is a fall of 3.2%. That's not what we would hope to see.
So How Risky Is TPC?
Statistically speaking companies that lose money are riskier than those that make money. And we do note that TPC had an earnings before interest and tax (EBIT) loss, over the last year. And over the same period it saw negative free cash outflow of ₩176m and booked a ₩3.5b accounting loss. But the saving grace is the ₩8.85b on the balance sheet. That kitty means the company can keep spending for growth for at least two years, at current rates. Even though its balance sheet seems sufficiently liquid, debt always makes us a little nervous if a company doesn't produce free cash flow regularly. When analysing debt levels, the balance sheet is the obvious place to start. But ultimately, every company can contain risks that exist outside of the balance sheet. For instance, we've identified 2 warning signs for TPC (1 is a bit unpleasant) you should be aware of.
When all is said and done, sometimes its easier to focus on companies that don't even need debt. Readers can access a list of growth stocks with zero net debt 100% free, right now.
Mobile Infrastructure for Defense and Disaster
The next wave in robotics isn't humanoid. Its fully autonomous towers delivering 5G, ISR, and radar in under 30 minutes, anywhere.
Get the investor briefing before the next round of contracts
Sponsored On Behalf of CiTechValuation is complex, but we're here to simplify it.
Discover if TPC might be undervalued or overvalued with our detailed analysis, featuring fair value estimates, potential risks, dividends, insider trades, and its financial condition.
Access Free AnalysisHave feedback on this article? Concerned about the content? Get in touch with us directly. Alternatively, email editorial-team (at) simplywallst.com.
This article by Simply Wall St is general in nature. We provide commentary based on historical data and analyst forecasts only using an unbiased methodology and our articles are not intended to be financial advice. It does not constitute a recommendation to buy or sell any stock, and does not take account of your objectives, or your financial situation. We aim to bring you long-term focused analysis driven by fundamental data. Note that our analysis may not factor in the latest price-sensitive company announcements or qualitative material. Simply Wall St has no position in any stocks mentioned.
About KOSDAQ:A130740
TPC
Manufactures and sells automotive parts in South Korea, the United States, Japan, Europe, China, and internationally.
Excellent balance sheet with low risk.
Market Insights

Weekly Picks

THE KINGDOM OF BROWN GOODS: WHY MGPI IS BEING CRUSHED BY INVENTORY & PRIMED FOR RESURRECTION


Why Vertical Aerospace (NYSE: EVTL) is Worth Possibly Over 13x its Current Price


The Quiet Giant That Became AI’s Power Grid
Recently Updated Narratives


A tech powerhouse quietly powering the world’s AI infrastructure.


Keppel DC REIT (SGX: AJBU) is a resilient gem in the data center space.
Why Vertical Aerospace (NYSE: EVTL) is Worth Possibly Over 13x its Current Price
Popular Narratives

MicroVision will explode future revenue by 380.37% with a vision towards success


Crazy Undervalued 42 Baggers Silver Play (Active & Running Mine)


