
Advertisement
- Japan
- /
- Electric Utilities
- /
- TSE:9502
Chubu Electric Power Company's (TSE:9502) five-year earnings growth trails the 16% YoY shareholder returns
Passive investing in index funds can generate returns that roughly match the overall market. But you can do a lot better than that by buying good quality businesses for attractive prices. For example, the Chubu Electric Power Company, Incorporated (TSE:9502) share price is 79% higher than it was five years ago, which is more than the market average. We're also happy to report the stock is up a healthy 23% in the last year.
The past week has proven to be lucrative for Chubu Electric Power Company investors, so let's see if fundamentals drove the company's five-year performance.
To paraphrase Benjamin Graham: Over the short term the market is a voting machine, but over the long term it's a weighing machine. One way to examine how market sentiment has changed over time is to look at the interaction between a company's share price and its earnings per share (EPS).
During the five years of share price growth, Chubu Electric Power Company moved from a loss to profitability. That would generally be considered a positive, so we'd hope to see the share price to rise.
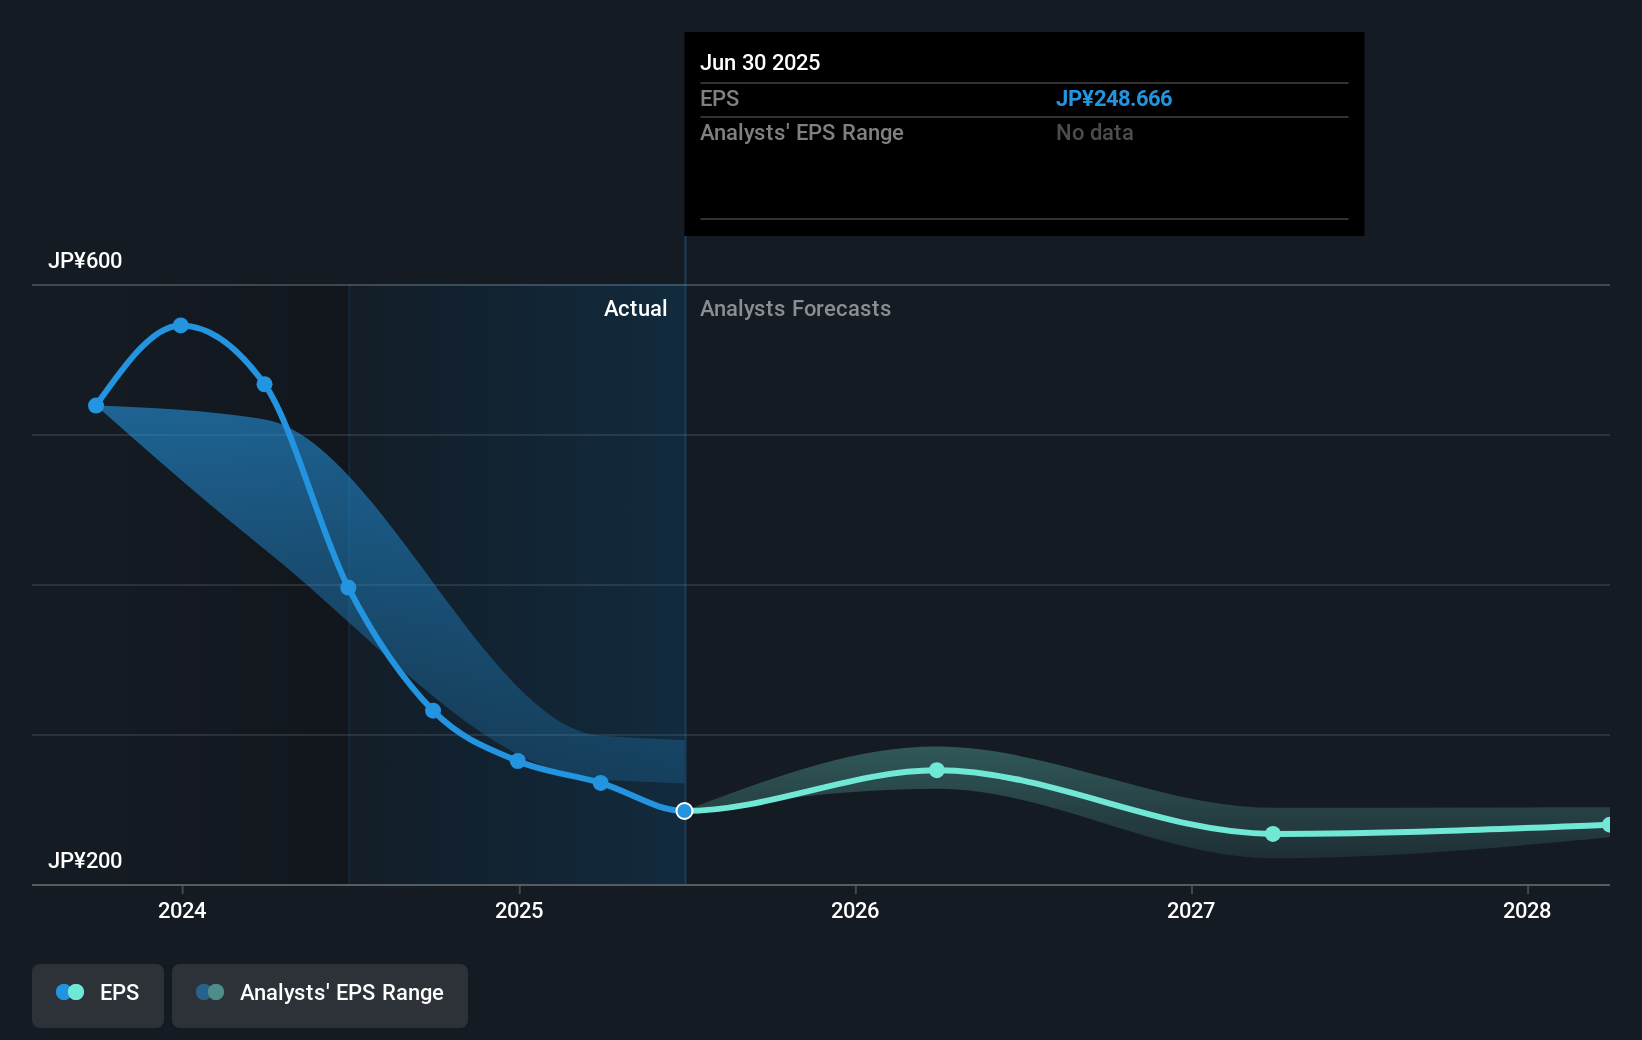
The graphic below depicts how EPS has changed over time (unveil the exact values by clicking on the image).
It's probably worth noting that the CEO is paid less than the median at similar sized companies. But while CEO remuneration is always worth checking, the really important question is whether the company can grow earnings going forward. Before buying or selling a stock, we always recommend a close examination of historic growth trends, available here..
What About Dividends?
When looking at investment returns, it is important to consider the difference between total shareholder return (TSR) and share price return. Whereas the share price return only reflects the change in the share price, the TSR includes the value of dividends (assuming they were reinvested) and the benefit of any discounted capital raising or spin-off. Arguably, the TSR gives a more comprehensive picture of the return generated by a stock. As it happens, Chubu Electric Power Company's TSR for the last 5 years was 112%, which exceeds the share price return mentioned earlier. And there's no prize for guessing that the dividend payments largely explain the divergence!
A Different Perspective
It's good to see that Chubu Electric Power Company has rewarded shareholders with a total shareholder return of 28% in the last twelve months. And that does include the dividend. That gain is better than the annual TSR over five years, which is 16%. Therefore it seems like sentiment around the company has been positive lately. Someone with an optimistic perspective could view the recent improvement in TSR as indicating that the business itself is getting better with time. While it is well worth considering the different impacts that market conditions can have on the share price, there are other factors that are even more important. Case in point: We've spotted 3 warning signs for Chubu Electric Power Company you should be aware of, and 1 of them makes us a bit uncomfortable.
We will like Chubu Electric Power Company better if we see some big insider buys. While we wait, check out this free list of undervalued stocks (mostly small caps) with considerable, recent, insider buying.
Please note, the market returns quoted in this article reflect the market weighted average returns of stocks that currently trade on Japanese exchanges.
New: AI Stock Screener & Alerts
Our new AI Stock Screener scans the market every day to uncover opportunities.
• Dividend Powerhouses (3%+ Yield)
• Undervalued Small Caps with Insider Buying
• High growth Tech and AI Companies
Or build your own from over 50 metrics.
Have feedback on this article? Concerned about the content? Get in touch with us directly. Alternatively, email editorial-team (at) simplywallst.com.
This article by Simply Wall St is general in nature. We provide commentary based on historical data and analyst forecasts only using an unbiased methodology and our articles are not intended to be financial advice. It does not constitute a recommendation to buy or sell any stock, and does not take account of your objectives, or your financial situation. We aim to bring you long-term focused analysis driven by fundamental data. Note that our analysis may not factor in the latest price-sensitive company announcements or qualitative material. Simply Wall St has no position in any stocks mentioned.
About TSE:9502
Chubu Electric Power Company
Engages in the generation, transmission, distribution, and retail of electricity in Japan and internationally.
Average dividend payer with mediocre balance sheet.
Market Insights

Advertisement
Community Narratives
Kodiak AI - a potential 100 bagger opportunity?
Fair Value US$14.00|41.9% undervalued
DA
Community Contributor
A Fair Price for a Great Business Facing Real Threats
Fair Value US$383.06|14.1% undervalued
IM
Community Contributor
AXON And Shopify Integration Will Unlock Global Mobile Advertising
Fair Value US$613.59|1.2% undervalued
AN
Based on Analyst Price Targets