

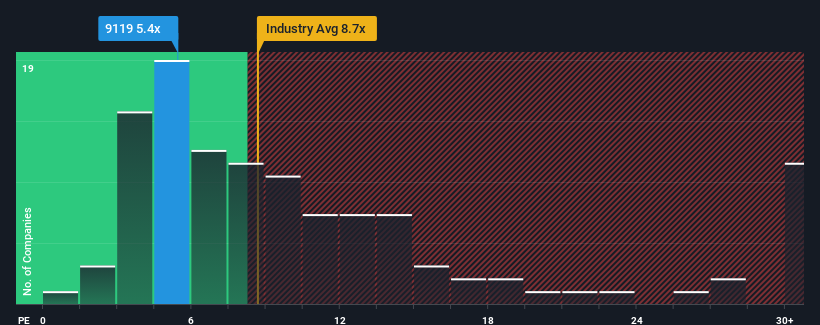
Iino Kaiun Kaisha, Ltd.'s (TSE:9119) price-to-earnings (or "P/E") ratio of 5.4x might make it look like a strong buy right now compared to the market in Japan, where around half of the companies have P/E ratios above 13x and even P/E's above 20x are quite common. Although, it's not wise to just take the P/E at face value as there may be an explanation why it's so limited.
We've discovered 2 warning signs about Iino Kaiun Kaisha. View them for free.For example, consider that Iino Kaiun Kaisha's financial performance has been pretty ordinary lately as earnings growth is non-existent. One possibility is that the P/E is low because investors think this benign earnings growth rate will likely underperform the broader market in the near future. If you like the company, you'd be hoping this isn't the case so that you could potentially pick up some stock while it's out of favour.
View our latest analysis for Iino Kaiun Kaisha
How Is Iino Kaiun Kaisha's Growth Trending?
In order to justify its P/E ratio, Iino Kaiun Kaisha would need to produce anemic growth that's substantially trailing the market.
Taking a look back first, we see that there was hardly any earnings per share growth to speak of for the company over the past year. Still, the latest three year period has seen an excellent 78% overall rise in EPS, in spite of its uninspiring short-term performance. So we can start by confirming that the company has done a great job of growing earnings over that time.
This is in contrast to the rest of the market, which is expected to grow by 9.9% over the next year, materially lower than the company's recent medium-term annualised growth rates.
With this information, we find it odd that Iino Kaiun Kaisha is trading at a P/E lower than the market. It looks like most investors are not convinced the company can maintain its recent growth rates.
The Bottom Line On Iino Kaiun Kaisha's P/E
Typically, we'd caution against reading too much into price-to-earnings ratios when settling on investment decisions, though it can reveal plenty about what other market participants think about the company.
Our examination of Iino Kaiun Kaisha revealed its three-year earnings trends aren't contributing to its P/E anywhere near as much as we would have predicted, given they look better than current market expectations. There could be some major unobserved threats to earnings preventing the P/E ratio from matching this positive performance. It appears many are indeed anticipating earnings instability, because the persistence of these recent medium-term conditions would normally provide a boost to the share price.
You always need to take note of risks, for example - Iino Kaiun Kaisha has 2 warning signs we think you should be aware of.
Of course, you might also be able to find a better stock than Iino Kaiun Kaisha. So you may wish to see this free collection of other companies that have reasonable P/E ratios and have grown earnings strongly.
If you're looking to trade Iino Kaiun Kaisha, open an account with the lowest-cost platform trusted by professionals, Interactive Brokers.
With clients in over 200 countries and territories, and access to 160 markets, IBKR lets you trade stocks, options, futures, forex, bonds and funds from a single integrated account.
Enjoy no hidden fees, no account minimums, and FX conversion rates as low as 0.03%, far better than what most brokers offer.
Sponsored ContentNew: AI Stock Screener & Alerts
Our new AI Stock Screener scans the market every day to uncover opportunities.
• Dividend Powerhouses (3%+ Yield)
• Undervalued Small Caps with Insider Buying
• High growth Tech and AI Companies
Or build your own from over 50 metrics.
Have feedback on this article? Concerned about the content? Get in touch with us directly. Alternatively, email editorial-team (at) simplywallst.com.
This article by Simply Wall St is general in nature. We provide commentary based on historical data and analyst forecasts only using an unbiased methodology and our articles are not intended to be financial advice. It does not constitute a recommendation to buy or sell any stock, and does not take account of your objectives, or your financial situation. We aim to bring you long-term focused analysis driven by fundamental data. Note that our analysis may not factor in the latest price-sensitive company announcements or qualitative material. Simply Wall St has no position in any stocks mentioned.
About TSE:9119
Iino Kaiun Kaisha
Engages in shipping and real estate businesses worldwide.
Established dividend payer and good value.
Market Insights

Community Narratives

