- Japan
- /
- Marine and Shipping
- /
- TSE:9107
Calculating The Fair Value Of Kawasaki Kisen Kaisha, Ltd. (TSE:9107)

Key Insights
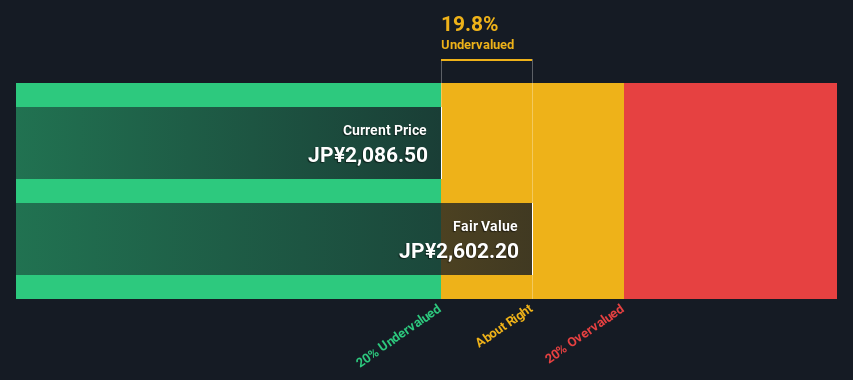
- The projected fair value for Kawasaki Kisen Kaisha is JP¥2,602 based on 2 Stage Free Cash Flow to Equity
- Kawasaki Kisen Kaisha's JP¥2,087 share price indicates it is trading at similar levels as its fair value estimate
- The JP¥2,101 analyst price target for 9107 is 19% less than our estimate of fair value
How far off is Kawasaki Kisen Kaisha, Ltd. (TSE:9107) from its intrinsic value? Using the most recent financial data, we'll take a look at whether the stock is fairly priced by estimating the company's future cash flows and discounting them to their present value. One way to achieve this is by employing the Discounted Cash Flow (DCF) model. There's really not all that much to it, even though it might appear quite complex.
We generally believe that a company's value is the present value of all of the cash it will generate in the future. However, a DCF is just one valuation metric among many, and it is not without flaws. For those who are keen learners of equity analysis, the Simply Wall St analysis model here may be something of interest to you.
See our latest analysis for Kawasaki Kisen Kaisha
The Calculation
We are going to use a two-stage DCF model, which, as the name states, takes into account two stages of growth. The first stage is generally a higher growth period which levels off heading towards the terminal value, captured in the second 'steady growth' period. To begin with, we have to get estimates of the next ten years of cash flows. Where possible we use analyst estimates, but when these aren't available we extrapolate the previous free cash flow (FCF) from the last estimate or reported value. We assume companies with shrinking free cash flow will slow their rate of shrinkage, and that companies with growing free cash flow will see their growth rate slow, over this period. We do this to reflect that growth tends to slow more in the early years than it does in later years.
A DCF is all about the idea that a dollar in the future is less valuable than a dollar today, so we discount the value of these future cash flows to their estimated value in today's dollars:
10-year free cash flow (FCF) estimate
| 2025 | 2026 | 2027 | 2028 | 2029 | 2030 | 2031 | 2032 | 2033 | 2034 | |
| Levered FCF (¥, Millions) | JP¥109.0b | JP¥65.7b | JP¥96.7b | JP¥92.2b | JP¥89.2b | JP¥87.3b | JP¥86.0b | JP¥85.2b | JP¥84.7b | JP¥84.4b |
| Growth Rate Estimate Source | Analyst x4 | Analyst x3 | Analyst x1 | Est @ -4.70% | Est @ -3.21% | Est @ -2.17% | Est @ -1.44% | Est @ -0.93% | Est @ -0.57% | Est @ -0.32% |
| Present Value (¥, Millions) Discounted @ 5.1% | JP¥103.7k | JP¥59.5k | JP¥83.3k | JP¥75.5k | JP¥69.5k | JP¥64.7k | JP¥60.6k | JP¥57.2k | JP¥54.1k | JP¥51.3k |
("Est" = FCF growth rate estimated by Simply Wall St)
Present Value of 10-year Cash Flow (PVCF) = JP¥679b
After calculating the present value of future cash flows in the initial 10-year period, we need to calculate the Terminal Value, which accounts for all future cash flows beyond the first stage. The Gordon Growth formula is used to calculate Terminal Value at a future annual growth rate equal to the 5-year average of the 10-year government bond yield of 0.3%. We discount the terminal cash flows to today's value at a cost of equity of 5.1%.
Terminal Value (TV)= FCF2034 × (1 + g) ÷ (r – g) = JP¥84b× (1 + 0.3%) ÷ (5.1%– 0.3%) = JP¥1.7t
Present Value of Terminal Value (PVTV)= TV / (1 + r)10= JP¥1.7t÷ ( 1 + 5.1%)10= JP¥1.1t
The total value is the sum of cash flows for the next ten years plus the discounted terminal value, which results in the Total Equity Value, which in this case is JP¥1.7t. In the final step we divide the equity value by the number of shares outstanding. Compared to the current share price of JP¥2.1k, the company appears about fair value at a 20% discount to where the stock price trades currently. The assumptions in any calculation have a big impact on the valuation, so it is better to view this as a rough estimate, not precise down to the last cent.
The Assumptions
We would point out that the most important inputs to a discounted cash flow are the discount rate and of course the actual cash flows. If you don't agree with these result, have a go at the calculation yourself and play with the assumptions. The DCF also does not consider the possible cyclicality of an industry, or a company's future capital requirements, so it does not give a full picture of a company's potential performance. Given that we are looking at Kawasaki Kisen Kaisha as potential shareholders, the cost of equity is used as the discount rate, rather than the cost of capital (or weighted average cost of capital, WACC) which accounts for debt. In this calculation we've used 5.1%, which is based on a levered beta of 0.976. Beta is a measure of a stock's volatility, compared to the market as a whole. We get our beta from the industry average beta of globally comparable companies, with an imposed limit between 0.8 and 2.0, which is a reasonable range for a stable business.
SWOT Analysis for Kawasaki Kisen Kaisha
- Debt is not viewed as a risk.
- Dividends are covered by earnings and cash flows.
- Dividend is in the top 25% of dividend payers in the market.
- Earnings declined over the past year.
- Current share price is below our estimate of fair value.
- Annual earnings are forecast to decline for the next 3 years.
Next Steps:
Although the valuation of a company is important, it is only one of many factors that you need to assess for a company. DCF models are not the be-all and end-all of investment valuation. Preferably you'd apply different cases and assumptions and see how they would impact the company's valuation. For instance, if the terminal value growth rate is adjusted slightly, it can dramatically alter the overall result. For Kawasaki Kisen Kaisha, there are three relevant aspects you should consider:
- Risks: Consider for instance, the ever-present spectre of investment risk. We've identified 4 warning signs with Kawasaki Kisen Kaisha (at least 2 which are potentially serious) , and understanding them should be part of your investment process.
- Future Earnings: How does 9107's growth rate compare to its peers and the wider market? Dig deeper into the analyst consensus number for the upcoming years by interacting with our free analyst growth expectation chart.
- Other Solid Businesses: Low debt, high returns on equity and good past performance are fundamental to a strong business. Why not explore our interactive list of stocks with solid business fundamentals to see if there are other companies you may not have considered!
PS. The Simply Wall St app conducts a discounted cash flow valuation for every stock on the TSE every day. If you want to find the calculation for other stocks just search here.
Valuation is complex, but we're here to simplify it.
Discover if Kawasaki Kisen Kaisha might be undervalued or overvalued with our detailed analysis, featuring fair value estimates, potential risks, dividends, insider trades, and its financial condition.
Access Free AnalysisHave feedback on this article? Concerned about the content? Get in touch with us directly. Alternatively, email editorial-team (at) simplywallst.com.
This article by Simply Wall St is general in nature. We provide commentary based on historical data and analyst forecasts only using an unbiased methodology and our articles are not intended to be financial advice. It does not constitute a recommendation to buy or sell any stock, and does not take account of your objectives, or your financial situation. We aim to bring you long-term focused analysis driven by fundamental data. Note that our analysis may not factor in the latest price-sensitive company announcements or qualitative material. Simply Wall St has no position in any stocks mentioned.
About TSE:9107
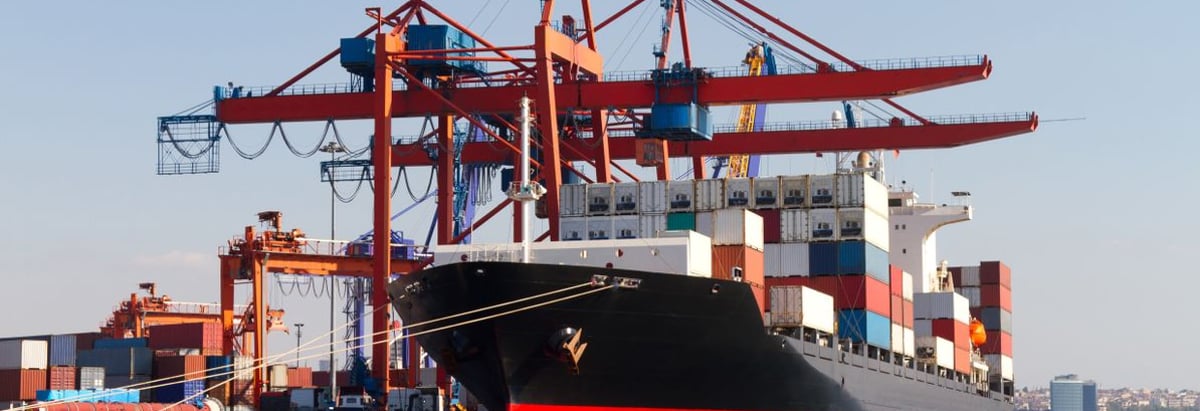
Kawasaki Kisen Kaisha
Provides marine, land, and air transportation services in Japan, the United States, Europe, Asia, and internationally.
Flawless balance sheet with solid track record and pays a dividend.
Similar Companies
Market Insights

Community Narratives

