
Advertisement
David Iben put it well when he said, 'Volatility is not a risk we care about. What we care about is avoiding the permanent loss of capital.' When we think about how risky a company is, we always like to look at its use of debt, since debt overload can lead to ruin. We can see that SBS Holdings, Inc. (TSE:2384) does use debt in its business. But the real question is whether this debt is making the company risky.
What Risk Does Debt Bring?
Generally speaking, debt only becomes a real problem when a company can't easily pay it off, either by raising capital or with its own cash flow. Ultimately, if the company can't fulfill its legal obligations to repay debt, shareholders could walk away with nothing. While that is not too common, we often do see indebted companies permanently diluting shareholders because lenders force them to raise capital at a distressed price. Of course, plenty of companies use debt to fund growth, without any negative consequences. When we think about a company's use of debt, we first look at cash and debt together.
Check out our latest analysis for SBS Holdings
What Is SBS Holdings's Debt?
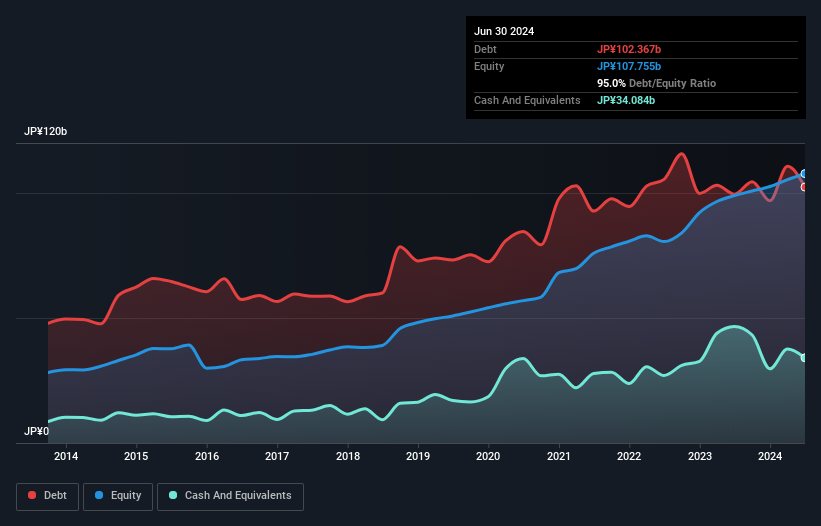
As you can see below, SBS Holdings had JP¥102.4b of debt, at June 2024, which is about the same as the year before. You can click the chart for greater detail. However, because it has a cash reserve of JP¥34.1b, its net debt is less, at about JP¥68.3b.
How Healthy Is SBS Holdings' Balance Sheet?
The latest balance sheet data shows that SBS Holdings had liabilities of JP¥103.7b due within a year, and liabilities of JP¥100.7b falling due after that. Offsetting this, it had JP¥34.1b in cash and JP¥62.8b in receivables that were due within 12 months. So its liabilities total JP¥107.5b more than the combination of its cash and short-term receivables.
Given this deficit is actually higher than the company's market capitalization of JP¥103.3b, we think shareholders really should watch SBS Holdings's debt levels, like a parent watching their child ride a bike for the first time. Hypothetically, extremely heavy dilution would be required if the company were forced to pay down its liabilities by raising capital at the current share price.
We use two main ratios to inform us about debt levels relative to earnings. The first is net debt divided by earnings before interest, tax, depreciation, and amortization (EBITDA), while the second is how many times its earnings before interest and tax (EBIT) covers its interest expense (or its interest cover, for short). Thus we consider debt relative to earnings both with and without depreciation and amortization expenses.
SBS Holdings's net debt to EBITDA ratio of about 2.4 suggests only moderate use of debt. And its strong interest cover of 21.3 times, makes us even more comfortable. Shareholders should be aware that SBS Holdings's EBIT was down 41% last year. If that earnings trend continues then paying off its debt will be about as easy as herding cats on to a roller coaster. There's no doubt that we learn most about debt from the balance sheet. But it is future earnings, more than anything, that will determine SBS Holdings's ability to maintain a healthy balance sheet going forward. So if you want to see what the professionals think, you might find this free report on analyst profit forecasts to be interesting.
Finally, a business needs free cash flow to pay off debt; accounting profits just don't cut it. So we always check how much of that EBIT is translated into free cash flow. In the last three years, SBS Holdings created free cash flow amounting to 16% of its EBIT, an uninspiring performance. For us, cash conversion that low sparks a little paranoia about is ability to extinguish debt.
Our View
We'd go so far as to say SBS Holdings's EBIT growth rate was disappointing. But at least it's pretty decent at covering its interest expense with its EBIT; that's encouraging. Overall, it seems to us that SBS Holdings's balance sheet is really quite a risk to the business. So we're almost as wary of this stock as a hungry kitten is about falling into its owner's fish pond: once bitten, twice shy, as they say. When analysing debt levels, the balance sheet is the obvious place to start. However, not all investment risk resides within the balance sheet - far from it. For example, we've discovered 3 warning signs for SBS Holdings (1 is concerning!) that you should be aware of before investing here.
At the end of the day, it's often better to focus on companies that are free from net debt. You can access our special list of such companies (all with a track record of profit growth). It's free.
New: Manage All Your Stock Portfolios in One Place
We've created the ultimate portfolio companion for stock investors, and it's free.
• Connect an unlimited number of Portfolios and see your total in one currency
• Be alerted to new Warning Signs or Risks via email or mobile
• Track the Fair Value of your stocks
Have feedback on this article? Concerned about the content? Get in touch with us directly. Alternatively, email editorial-team (at) simplywallst.com.
This article by Simply Wall St is general in nature. We provide commentary based on historical data and analyst forecasts only using an unbiased methodology and our articles are not intended to be financial advice. It does not constitute a recommendation to buy or sell any stock, and does not take account of your objectives, or your financial situation. We aim to bring you long-term focused analysis driven by fundamental data. Note that our analysis may not factor in the latest price-sensitive company announcements or qualitative material. Simply Wall St has no position in any stocks mentioned.
About TSE:2384
Reasonable growth potential with adequate balance sheet and pays a dividend.
Market Insights

Advertisement
Community Narratives
The company that turned a verb into a global necessity and basically runs the modern internet, digital ads, smartphones, maps, and AI.
Fair Value US$300.00|6.3% undervalued
OS
Community Contributor
Flowers Foods Pays A Fair Price For Health
Fair Value US$16.12|26.0% undervalued
NV
Community Contributor
TMX Group will thrive with 33.3% profit margin and enduring market moat
Fair Value CA$49.90|3.7% overvalued
LI
Community Contributor