- Japan
- /
- Electronic Equipment and Components
- /
- TSE:6866
Hioki E.E (TSE:6866) jumps 12% this week, though earnings growth is still tracking behind five-year shareholder returns


The most you can lose on any stock (assuming you don't use leverage) is 100% of your money. But when you pick a company that is really flourishing, you can make more than 100%. For instance, the price of Hioki E.E. Corporation (TSE:6866) stock is up an impressive 112% over the last five years. In the last week the share price is up 12%.
After a strong gain in the past week, it's worth seeing if longer term returns have been driven by improving fundamentals.
See our latest analysis for Hioki E.E
To quote Buffett, 'Ships will sail around the world but the Flat Earth Society will flourish. There will continue to be wide discrepancies between price and value in the marketplace...' By comparing earnings per share (EPS) and share price changes over time, we can get a feel for how investor attitudes to a company have morphed over time.
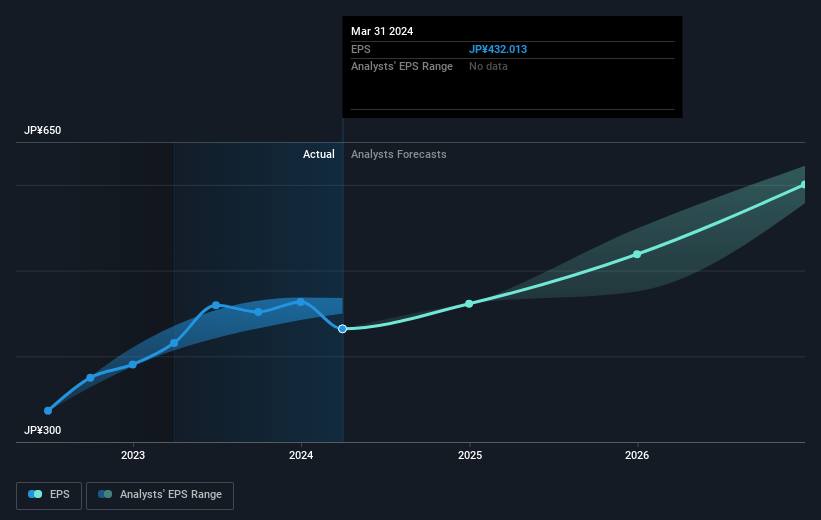
During five years of share price growth, Hioki E.E achieved compound earnings per share (EPS) growth of 17% per year. That makes the EPS growth particularly close to the yearly share price growth of 16%. That suggests that the market sentiment around the company hasn't changed much over that time. Rather, the share price has approximately tracked EPS growth.
You can see how EPS has changed over time in the image below (click on the chart to see the exact values).
We know that Hioki E.E has improved its bottom line over the last three years, but what does the future have in store? Take a more thorough look at Hioki E.E's financial health with this free report on its balance sheet.
What About Dividends?
It is important to consider the total shareholder return, as well as the share price return, for any given stock. The TSR is a return calculation that accounts for the value of cash dividends (assuming that any dividend received was reinvested) and the calculated value of any discounted capital raisings and spin-offs. Arguably, the TSR gives a more comprehensive picture of the return generated by a stock. In the case of Hioki E.E, it has a TSR of 137% for the last 5 years. That exceeds its share price return that we previously mentioned. And there's no prize for guessing that the dividend payments largely explain the divergence!
A Different Perspective
Investors in Hioki E.E had a tough year, with a total loss of 11% (including dividends), against a market gain of about 30%. However, keep in mind that even the best stocks will sometimes underperform the market over a twelve month period. On the bright side, long term shareholders have made money, with a gain of 19% per year over half a decade. It could be that the recent sell-off is an opportunity, so it may be worth checking the fundamental data for signs of a long term growth trend. While it is well worth considering the different impacts that market conditions can have on the share price, there are other factors that are even more important. To that end, you should be aware of the 2 warning signs we've spotted with Hioki E.E .
But note: Hioki E.E may not be the best stock to buy. So take a peek at this free list of interesting companies with past earnings growth (and further growth forecast).
Please note, the market returns quoted in this article reflect the market weighted average returns of stocks that currently trade on Japanese exchanges.
Valuation is complex, but we're here to simplify it.
Discover if Hioki E.E might be undervalued or overvalued with our detailed analysis, featuring fair value estimates, potential risks, dividends, insider trades, and its financial condition.
Access Free AnalysisHave feedback on this article? Concerned about the content? Get in touch with us directly. Alternatively, email editorial-team (at) simplywallst.com.
This article by Simply Wall St is general in nature. We provide commentary based on historical data and analyst forecasts only using an unbiased methodology and our articles are not intended to be financial advice. It does not constitute a recommendation to buy or sell any stock, and does not take account of your objectives, or your financial situation. We aim to bring you long-term focused analysis driven by fundamental data. Note that our analysis may not factor in the latest price-sensitive company announcements or qualitative material. Simply Wall St has no position in any stocks mentioned.
Have feedback on this article? Concerned about the content? Get in touch with us directly. Alternatively, email editorial-team@simplywallst.com
About TSE:6866
Hioki E.E
Develops, manufactures, sells, and services electrical measuring instruments in Japan, China, rest of Asia, America, Europe, and internationally.
Flawless balance sheet average dividend payer.
Similar Companies
Market Insights

Community Narratives
