- Japan
- /
- Electronic Equipment and Components
- /
- TSE:6777
The total return for santec Holdings (TSE:6777) investors has risen faster than earnings growth over the last three years


It might be of some concern to shareholders to see the santec Holdings Corporation (TSE:6777) share price down 20% in the last month. But over the last three years the stock has shone bright like a diamond. Over that time, we've been excited to watch the share price climb an impressive 350%. So you might argue that the recent reduction in the share price is unremarkable in light of the longer term performance. The thing to consider is whether there is still too much elation around the company's prospects.
While the stock has fallen 12% this week, it's worth focusing on the longer term and seeing if the stocks historical returns have been driven by the underlying fundamentals.
View our latest analysis for santec Holdings
To paraphrase Benjamin Graham: Over the short term the market is a voting machine, but over the long term it's a weighing machine. One imperfect but simple way to consider how the market perception of a company has shifted is to compare the change in the earnings per share (EPS) with the share price movement.
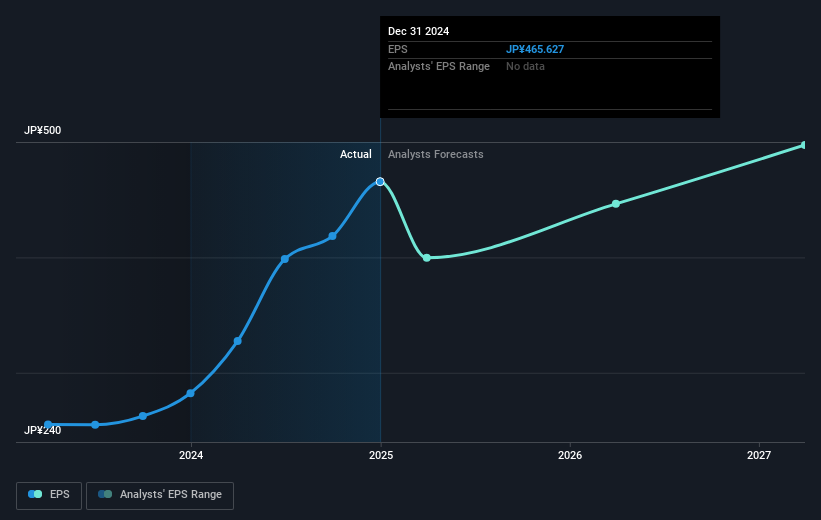
During three years of share price growth, santec Holdings achieved compound earnings per share growth of 73% per year. We note that the 65% yearly (average) share price gain isn't too far from the EPS growth rate. Coincidence? Probably not. This suggests that sentiment and expectations have not changed drastically. Quite to the contrary, the share price has arguably reflected the EPS growth.
The graphic below depicts how EPS has changed over time (unveil the exact values by clicking on the image).
We know that santec Holdings has improved its bottom line over the last three years, but what does the future have in store? This free interactive report on santec Holdings' balance sheet strength is a great place to start, if you want to investigate the stock further.
What About Dividends?
It is important to consider the total shareholder return, as well as the share price return, for any given stock. The TSR incorporates the value of any spin-offs or discounted capital raisings, along with any dividends, based on the assumption that the dividends are reinvested. Arguably, the TSR gives a more comprehensive picture of the return generated by a stock. As it happens, santec Holdings' TSR for the last 3 years was 391%, which exceeds the share price return mentioned earlier. This is largely a result of its dividend payments!
A Different Perspective
It's good to see that santec Holdings has rewarded shareholders with a total shareholder return of 8.4% in the last twelve months. And that does include the dividend. However, the TSR over five years, coming in at 33% per year, is even more impressive. The pessimistic view would be that be that the stock has its best days behind it, but on the other hand the price might simply be moderating while the business itself continues to execute. I find it very interesting to look at share price over the long term as a proxy for business performance. But to truly gain insight, we need to consider other information, too. Consider risks, for instance. Every company has them, and we've spotted 1 warning sign for santec Holdings you should know about.
But note: santec Holdings may not be the best stock to buy. So take a peek at this free list of interesting companies with past earnings growth (and further growth forecast).
Please note, the market returns quoted in this article reflect the market weighted average returns of stocks that currently trade on Japanese exchanges.
New: AI Stock Screener & Alerts
Our new AI Stock Screener scans the market every day to uncover opportunities.
• Dividend Powerhouses (3%+ Yield)
• Undervalued Small Caps with Insider Buying
• High growth Tech and AI Companies
Or build your own from over 50 metrics.
Have feedback on this article? Concerned about the content? Get in touch with us directly. Alternatively, email editorial-team (at) simplywallst.com.
This article by Simply Wall St is general in nature. We provide commentary based on historical data and analyst forecasts only using an unbiased methodology and our articles are not intended to be financial advice. It does not constitute a recommendation to buy or sell any stock, and does not take account of your objectives, or your financial situation. We aim to bring you long-term focused analysis driven by fundamental data. Note that our analysis may not factor in the latest price-sensitive company announcements or qualitative material. Simply Wall St has no position in any stocks mentioned.
About TSE:6777
santec Holdings
Develops, manufactures, and sells components for fiber optic telecommunication systems.
Outstanding track record with excellent balance sheet and pays a dividend.
Market Insights

Community Narratives
