Advertisement
- Japan
- /
- Electronic Equipment and Components
- /
- TSE:6645
What Does the Recent 10% Surge Mean for OMRON Shares in 2025?

Simply Wall St
Reviewed by Bailey Pemberton
Thinking about what to do with OMRON stock right now? If you’re like a lot of investors, you’ve probably noticed how dramatic its price moves have been recently. This is the company that just posted a 10.1% gain over the last week and is up 14.8% in the past month. That kind of momentum always gets people talking and, for OMRON, it seems to signal a short-term swing in sentiment. At the same time, it’s hard to ignore the longer-term trend, with shares down 13.6% since the start of the year and off by over 30% both over the past year and the past three years. Zoom out even further, and OMRON shares are down 37.4% over five years. That’s a tough stretch and it tells a story of shifting expectations and market developments shaping how investors see the company’s future risk and reward.
The next logical question is valuation. Are these swings opening a door for investors or just reflecting a different set of risks? When looking at OMRON through several common valuation checks (six in total), it’s undervalued according to just one of them. That gives the company a value score of 1, so the numbers aren’t exactly screaming “bargain” just yet. Still, valuation is never as simple as a checklist. In the sections ahead, we’ll walk through each approach, see what they reveal, and I’ll share one strategy that might give you a clearer picture than any checklist or ratio alone.
OMRON scores just 1/6 on our valuation checks. See what other red flags we found in the full valuation breakdown.
Approach 1: OMRON Discounted Cash Flow (DCF) Analysis
The Discounted Cash Flow (DCF) model estimates a company’s intrinsic value by projecting its future free cash flows and discounting them back to today’s value. In essence, it asks: if you could own all of OMRON’s future cash flows right now, what would they be worth?
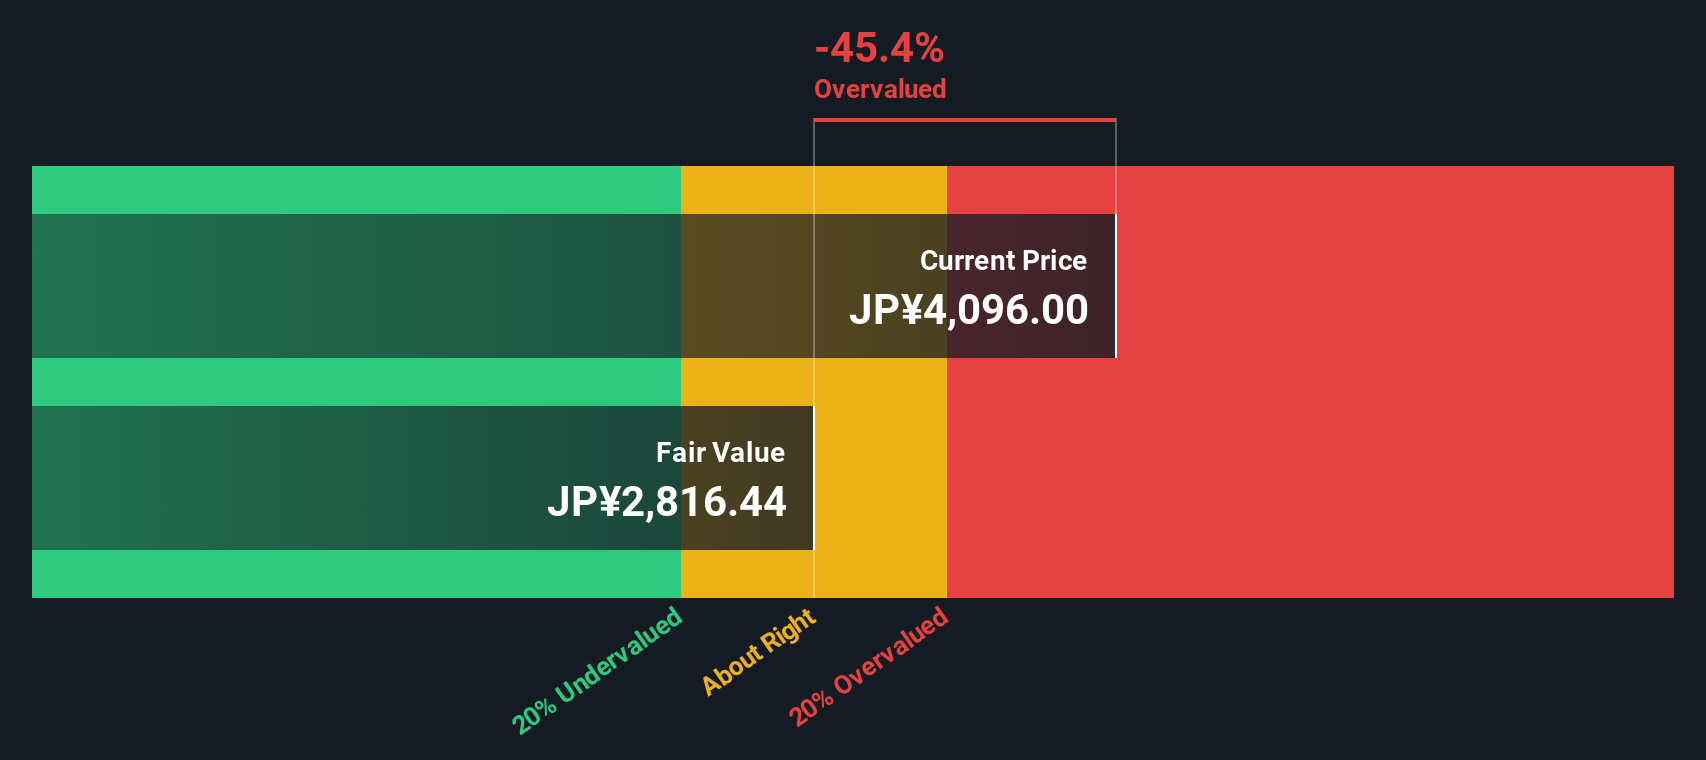
For OMRON, the latest reported Free Cash Flow sits at ¥16.97 billion. Analysts have projected these to rise sharply over the next five years, with Simply Wall St extrapolating further, leading to a projected Free Cash Flow of approximately ¥40.86 billion by 2030. The forecasts point to robust near-term growth, though ultimate reliability drops as projections stretch further into the future.
Based on this DCF analysis, the estimated fair value for OMRON shares is ¥2,792.60. However, when compared to the current market price, the DCF suggests the stock is about 59.6% overvalued. In short, even with optimistic cash flow projections, OMRON looks pricey at current levels.
Result: OVERVALUED
Our Discounted Cash Flow (DCF) analysis suggests OMRON may be overvalued by 59.6%. Find undervalued stocks or create your own screener to find better value opportunities.
Approach 2: OMRON Price vs Earnings
The Price-to-Earnings (PE) ratio is the preferred multiple for assessing a profitable company like OMRON, as it directly compares the market price of its shares with its reported earnings. This metric is useful because it helps investors understand how much they are paying for each yen of earnings, which is especially relevant when the company generates steady profits.
It’s important to remember that a company’s “normal” or “fair” PE ratio isn’t set in stone. Higher growth expectations or lower risk can justify a higher PE ratio, while slower growth or more risk typically means a lower PE is warranted. That’s why simply referencing the current PE ratio in isolation can be misleading.
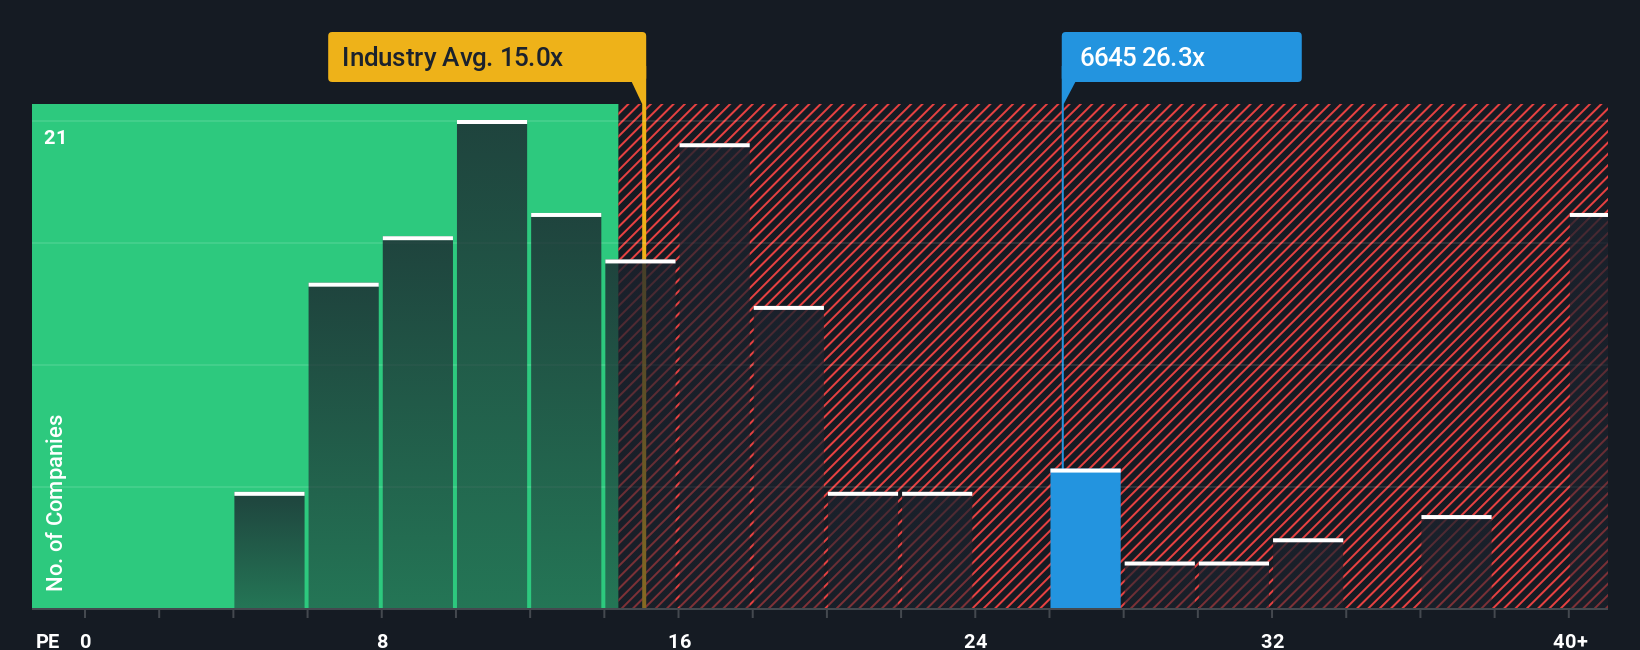
Currently, OMRON trades at a PE of 26.8x. For context, this is below the average PE of its peers, which sits at 30.0x. However, it is noticeably above the Electronic industry average of 14.9x. These benchmarks offer useful reference points, but they do not capture everything that matters for valuation.
This leads us to the concept of the “Fair Ratio,” a proprietary metric from Simply Wall St that calculates what a justifiable PE would be for OMRON based on expected growth, industry position, profit margin, market cap, and company-specific risks. Unlike simple peer or industry comparisons, the Fair Ratio adjusts for the nuances that make each company distinct, so it aims to deliver a more tailored valuation target.
For OMRON, the Fair Ratio is estimated at 21.0x. With the actual PE standing at 26.8x, the shares appear somewhat expensive relative to where they should be given the company’s fundamentals and risk profile.
Result: OVERVALUED
PE ratios tell one story, but what if the real opportunity lies elsewhere? Discover companies where insiders are betting big on explosive growth.
Upgrade Your Decision Making: Choose your OMRON Narrative
Earlier, we mentioned there is an even better way to understand valuation, so let’s introduce you to Narratives. A Narrative is simply the story you attach to a company, combining your outlook (like future revenue, profits, and margins) with a fair value target you believe reflects OMRON’s real potential. Instead of relying only on numbers or checklists, Narratives link OMRON’s business story to real financial forecasts and then compare your estimate of fair value to today’s share price.
Narratives are easy to use and available directly on the Simply Wall St platform’s Community page, trusted by millions of investors. They help you decide when to buy or sell by making it simple to see whether your story says the stock is undervalued or overpriced.
Best of all, Narratives are dynamic. If new news or earnings come in, your Narrative’s fair value updates automatically. For example, some investors might base their OMRON Narrative on high-growth assumptions and set a much higher fair value, while others take a more cautious approach and see the stock as fairly valued or even overvalued. This demonstrates how everyone’s Narrative can be unique and adaptable.
Do you think there's more to the story for OMRON? Create your own Narrative to let the Community know!
This article by Simply Wall St is general in nature. We provide commentary based on historical data and analyst forecasts only using an unbiased methodology and our articles are not intended to be financial advice. It does not constitute a recommendation to buy or sell any stock, and does not take account of your objectives, or your financial situation. We aim to bring you long-term focused analysis driven by fundamental data. Note that our analysis may not factor in the latest price-sensitive company announcements or qualitative material. Simply Wall St has no position in any stocks mentioned.
New: AI Stock Screener & Alerts
Our new AI Stock Screener scans the market every day to uncover opportunities.
• Dividend Powerhouses (3%+ Yield)
• Undervalued Small Caps with Insider Buying
• High growth Tech and AI Companies
Or build your own from over 50 metrics.
Have feedback on this article? Concerned about the content? Get in touch with us directly. Alternatively, email editorial-team@simplywallst.com
About TSE:6645
OMRON
Engages in industrial automation, device and module solutions, data solution business, social systems, and healthcare businesses internationally.
Excellent balance sheet second-rate dividend payer.
Similar Companies
Market Insights

Advertisement
Community Narratives
A formidable player in AI and enterprise computing.
Fair Value US$210.00|12.2% overvalued
CO
Community Contributor
IREN's Bold Moves in Sustainable Bitcoin Mining & AI Data Centers
Fair Value US$72.52|17.1% undervalued
BL
Community Contributor
Cooling the Champions: The Aussie Tech Behind F1's Victories
Fair Value AU$12.40|38.7% undervalued
TR
Community Contributor