- Japan
- /
- Electronic Equipment and Components
- /
- TSE:2737
Exploring Top Dividend Stocks In June 2024

Reviewed by Simply Wall St

As global markets exhibit mixed signals with some regions showing signs of economic recovery while others grapple with challenges, investors continue to seek stable returns amidst uncertainty. In this context, dividend stocks remain a compelling option for those looking to generate consistent income from their investments.
Top 10 Dividend Stocks
| Name | Dividend Yield | Dividend Rating |
| Ping An Bank (SZSE:000001) | 7.06% | ★★★★★★ |
| Allianz (XTRA:ALV) | 5.38% | ★★★★★★ |
| Guaranty Trust Holding (NGSE:GTCO) | 7.61% | ★★★★★★ |
| Sonae SGPS (ENXTLS:SON) | 6.25% | ★★★★★★ |
| Huntington Bancshares (NasdaqGS:HBAN) | 5.02% | ★★★★★★ |
| Globeride (TSE:7990) | 3.65% | ★★★★★★ |
| KurimotoLtd (TSE:5602) | 5.18% | ★★★★★★ |
| Banque Cantonale Vaudoise (SWX:BCVN) | 4.58% | ★★★★★★ |
| GakkyushaLtd (TSE:9769) | 4.18% | ★★★★★★ |
| Innotech (TSE:9880) | 4.08% | ★★★★★★ |
Click here to see the full list of 1954 stocks from our Top Dividend Stocks screener.
We'll examine a selection from our screener results.
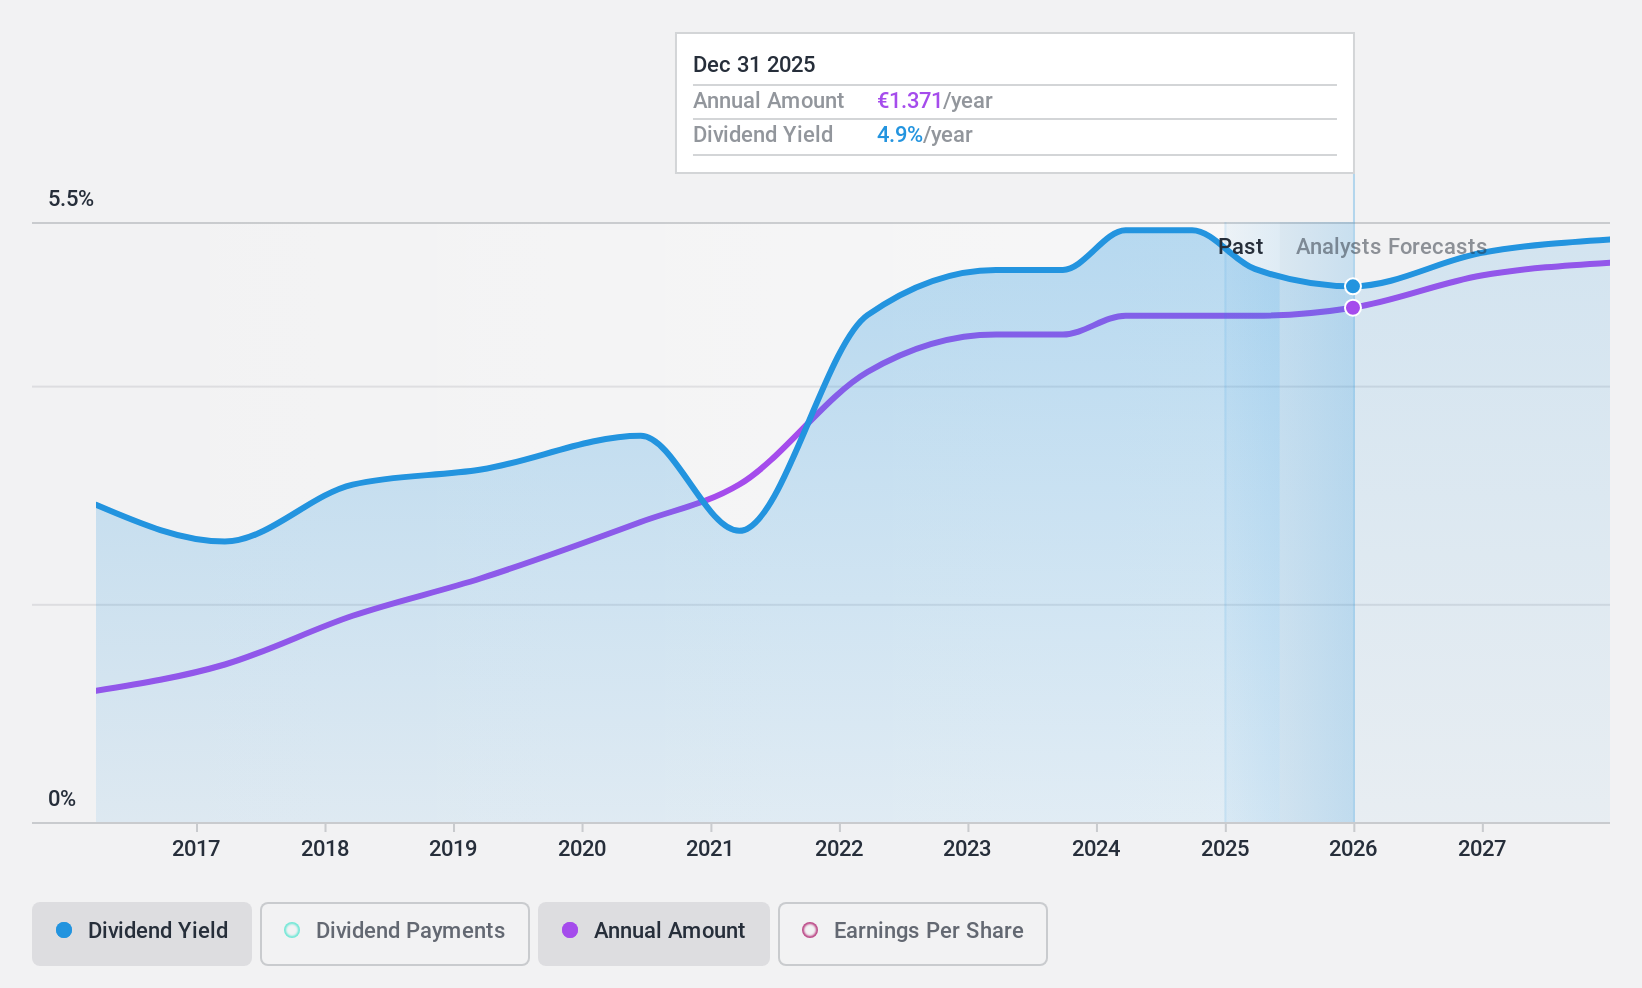
Valmet Oyj (HLSE:VALMT)
Simply Wall St Dividend Rating: ★★★★☆☆
Overview: Valmet Oyj is a global provider of process technologies, automation, and services for the pulp, paper, and energy industries, with a market capitalization of approximately €4.31 billion.
Operations: Valmet Oyj generates revenue through three key segments: Services (€1.80 billion), Automation (€1.33 billion), and Process Technologies (€2.29 billion).
Dividend Yield: 5.1%
Valmet Oyj, a Finnish company, has seen a consistent increase in dividend payments over the past decade, demonstrating reliability in its distributions to shareholders. However, the current dividend yield of 5.11% is modest compared to the top quartile of Finnish dividend stocks at 5.87%. While earnings are projected to grow by 7.7% annually, Valmet's dividends are not fully covered by cash flow, with a high cash payout ratio of 162.5%, indicating potential sustainability issues if current trends continue without adjustment.
- Click here and access our complete dividend analysis report to understand the dynamics of Valmet Oyj.
- Our expertly prepared valuation report Valmet Oyj implies its share price may be lower than expected.
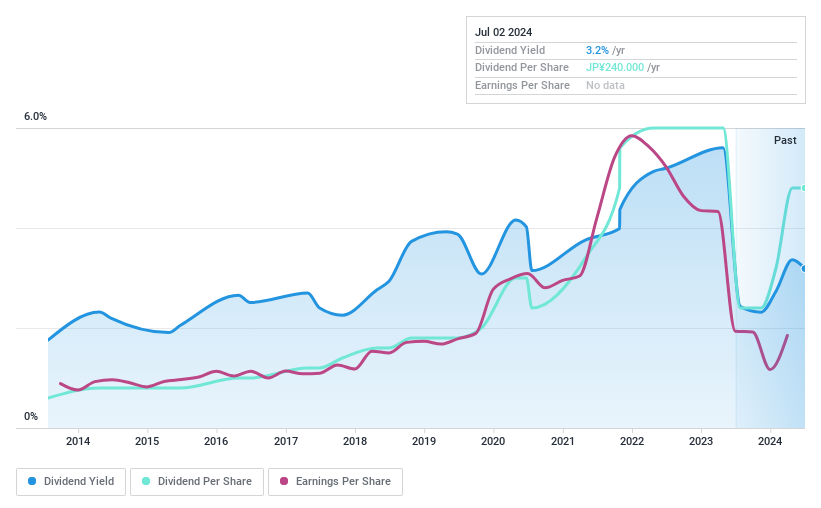
Tomen Devices (TSE:2737)
Simply Wall St Dividend Rating: ★★★★☆☆
Overview: Tomen Devices Corporation, an electronics trading company based in Japan, has a market capitalization of approximately ¥49.78 billion.
Operations: Tomen Devices Corporation generates ¥14.81 billion in revenue from its domestic operations and ¥26.48 billion from international markets.
Dividend Yield: 3.1%
Tomen Devices exhibits a mixed performance in its dividend profile. Despite a reasonable payout ratio of 64.9%, ensuring dividends are covered by earnings, and a low cash payout ratio of 39.3% indicating coverage by cash flows, the company's dividend history has been unstable with volatile payments over the past decade. Additionally, recent profit margins have declined to 0.6% from last year's 1.2%, and its dividend yield of 3.12% trails behind the top quartile in the Japanese market at 3.47%.
- Get an in-depth perspective on Tomen Devices' performance by reading our dividend report here.
- Our valuation report unveils the possibility Tomen Devices' shares may be trading at a premium.
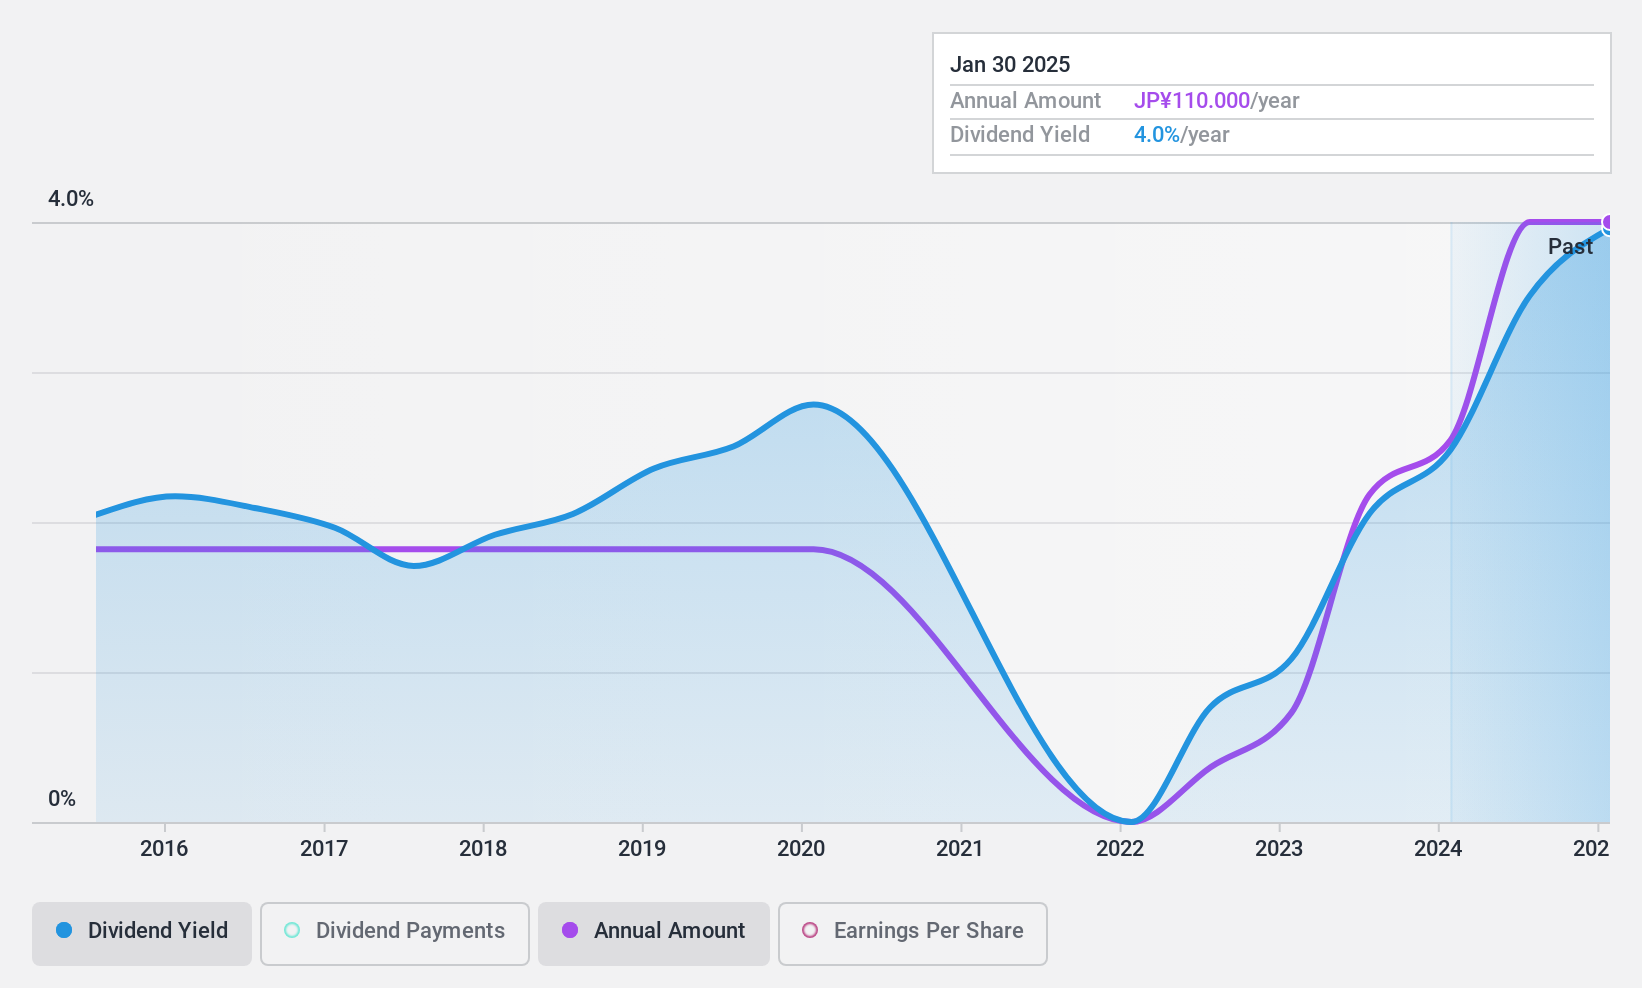
Toho (TSE:8142)
Simply Wall St Dividend Rating: ★★★★☆☆
Overview: Toho Co., Ltd. operates in the food wholesale, cash and carry, and supermarket sectors mainly in Japan, with a market capitalization of approximately ¥33.67 billion.
Operations: Toho Co., Ltd. generates its revenue primarily from the food wholesale, cash and carry, and supermarket sectors in Japan.
Dividend Yield: 3.1%
Toho's dividend sustainability is supported by a low payout ratio of 9% and a cash payout ratio of 16.2%, indicating solid coverage by both earnings and cash flows. However, the company has struggled with dividend reliability, exhibiting volatile payments over the past decade. Despite this, Toho maintains a competitive edge with a price-to-earnings ratio of 10.7x, below the Japanese market average of 14x. Yet, its debt level is high and its dividend yield at 3.06% remains below the top quartile benchmark of 3.47%.
- Click here to discover the nuances of Toho with our detailed analytical dividend report.
- Our comprehensive valuation report raises the possibility that Toho is priced higher than what may be justified by its financials.
Next Steps
- Gain an insight into the universe of 1954 Top Dividend Stocks by clicking here.
- Are any of these part of your asset mix? Tap into the analytical power of Simply Wall St's portfolio to get a 360-degree view on how they're shaping up.
- Maximize your investment potential with Simply Wall St, the comprehensive app that offers global market insights for free.
Looking For Alternative Opportunities?
- Explore high-performing small cap companies that haven't yet garnered significant analyst attention.
- Fuel your portfolio with companies showing strong growth potential, backed by optimistic outlooks both from analysts and management.
- Find companies with promising cash flow potential yet trading below their fair value.
This article by Simply Wall St is general in nature. We provide commentary based on historical data and analyst forecasts only using an unbiased methodology and our articles are not intended to be financial advice. It does not constitute a recommendation to buy or sell any stock, and does not take account of your objectives, or your financial situation. We aim to bring you long-term focused analysis driven by fundamental data. Note that our analysis may not factor in the latest price-sensitive company announcements or qualitative material. Simply Wall St has no position in any stocks mentioned.
Valuation is complex, but we're here to simplify it.
Discover if Tomen Devices might be undervalued or overvalued with our detailed analysis, featuring fair value estimates, potential risks, dividends, insider trades, and its financial condition.
Access Free AnalysisHave feedback on this article? Concerned about the content? Get in touch with us directly. Alternatively, email editorial-team@simplywallst.com
About TSE:2737
Solid track record average dividend payer.
