We're Interested To See How Access (TSE:4813) Uses Its Cash Hoard To Grow

Just because a business does not make any money, does not mean that the stock will go down. For example, although software-as-a-service business Salesforce.com lost money for years while it grew recurring revenue, if you held shares since 2005, you'd have done very well indeed. But the harsh reality is that very many loss making companies burn through all their cash and go bankrupt.
So, the natural question for Access (TSE:4813) shareholders is whether they should be concerned by its rate of cash burn. For the purposes of this article, cash burn is the annual rate at which an unprofitable company spends cash to fund its growth; its negative free cash flow. Let's start with an examination of the business' cash, relative to its cash burn.
View our latest analysis for Access
Does Access Have A Long Cash Runway?
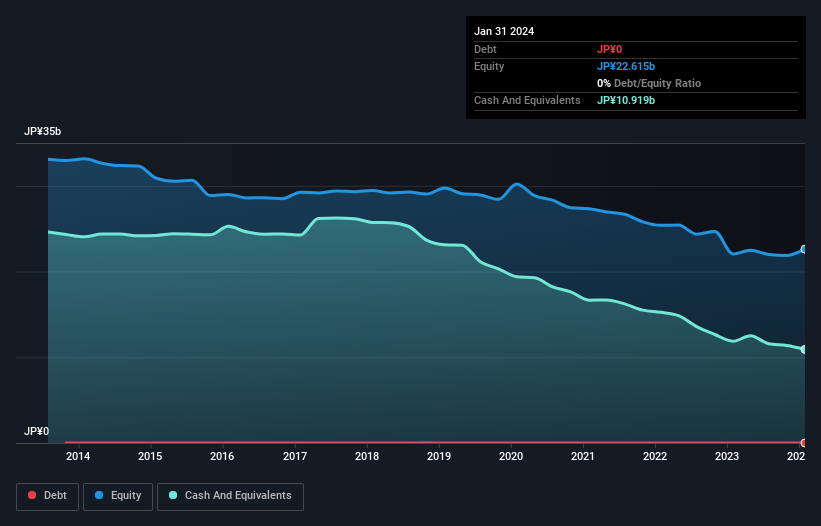
A company's cash runway is calculated by dividing its cash hoard by its cash burn. In January 2024, Access had JP¥11b in cash, and was debt-free. Looking at the last year, the company burnt through JP¥1.2b. That means it had a cash runway of about 9.3 years as of January 2024. Even though this is but one measure of the company's cash burn, the thought of such a long cash runway warms our bellies in a comforting way. Depicted below, you can see how its cash holdings have changed over time.
How Well Is Access Growing?
It was fairly positive to see that Access reduced its cash burn by 36% during the last year. And considering that its operating revenue gained 27% during that period, that's great to see. We think it is growing rather well, upon reflection. In reality, this article only makes a short study of the company's growth data. This graph of historic earnings and revenue shows how Access is building its business over time.
How Hard Would It Be For Access To Raise More Cash For Growth?
While Access seems to be in a decent position, we reckon it is still worth thinking about how easily it could raise more cash, if that proved desirable. Generally speaking, a listed business can raise new cash through issuing shares or taking on debt. Many companies end up issuing new shares to fund future growth. By comparing a company's annual cash burn to its total market capitalisation, we can estimate roughly how many shares it would have to issue in order to run the company for another year (at the same burn rate).
Access has a market capitalisation of JP¥55b and burnt through JP¥1.2b last year, which is 2.2% of the company's market value. That means it could easily issue a few shares to fund more growth, and might well be in a position to borrow cheaply.
So, Should We Worry About Access' Cash Burn?
It may already be apparent to you that we're relatively comfortable with the way Access is burning through its cash. For example, we think its cash runway suggests that the company is on a good path. Its cash burn reduction wasn't quite as good, but was still rather encouraging! Looking at all the measures in this article, together, we're not worried about its rate of cash burn; the company seems well on top of its medium-term spending needs. Taking an in-depth view of risks, we've identified 2 warning signs for Access that you should be aware of before investing.
Of course, you might find a fantastic investment by looking elsewhere. So take a peek at this free list of companies with significant insider holdings, and this list of stocks growth stocks (according to analyst forecasts)
The New Payments ETF Is Live on NASDAQ:
Money is moving to real-time rails, and a newly listed ETF now gives investors direct exposure. Fast settlement. Institutional custody. Simple access.
Explore how this launch could reshape portfolios
Sponsored ContentNew: Manage All Your Stock Portfolios in One Place
We've created the ultimate portfolio companion for stock investors, and it's free.
• Connect an unlimited number of Portfolios and see your total in one currency
• Be alerted to new Warning Signs or Risks via email or mobile
• Track the Fair Value of your stocks
Have feedback on this article? Concerned about the content? Get in touch with us directly. Alternatively, email editorial-team (at) simplywallst.com.
This article by Simply Wall St is general in nature. We provide commentary based on historical data and analyst forecasts only using an unbiased methodology and our articles are not intended to be financial advice. It does not constitute a recommendation to buy or sell any stock, and does not take account of your objectives, or your financial situation. We aim to bring you long-term focused analysis driven by fundamental data. Note that our analysis may not factor in the latest price-sensitive company announcements or qualitative material. Simply Wall St has no position in any stocks mentioned.
About TSE:4813
Access
Provides IT solutions and products in Japan, America, Europe, the Middle East, Africa, Asia, Oceania, and internationally.
Flawless balance sheet and slightly overvalued.
Market Insights

Weekly Picks

THE KINGDOM OF BROWN GOODS: WHY MGPI IS BEING CRUSHED BY INVENTORY & PRIMED FOR RESURRECTION


Why Vertical Aerospace (NYSE: EVTL) is Worth Possibly Over 13x its Current Price


The Quiet Giant That Became AI’s Power Grid
Recently Updated Narratives


MINISO's fair value is projected at 26.69 with an anticipated PE ratio shift of 20x

Fiverr International will transform the freelance industry with AI-powered growth

Jackson Financial Stock: When Insurance Math Meets a Shifting Claims Landscape
Popular Narratives


MicroVision will explode future revenue by 380.37% with a vision towards success


Crazy Undervalued 42 Baggers Silver Play (Active & Running Mine)


