
Advertisement
Otsuka Corporation's (TSE:4768) Fundamentals Look Pretty Strong: Could The Market Be Wrong About The Stock?

It is hard to get excited after looking at Otsuka's (TSE:4768) recent performance, when its stock has declined 9.6% over the past three months. However, the company's fundamentals look pretty decent, and long-term financials are usually aligned with future market price movements. In this article, we decided to focus on Otsuka's ROE.
Return on equity or ROE is a key measure used to assess how efficiently a company's management is utilizing the company's capital. In short, ROE shows the profit each dollar generates with respect to its shareholder investments.
How To Calculate Return On Equity?
Return on equity can be calculated by using the formula:
Return on Equity = Net Profit (from continuing operations) ÷ Shareholders' Equity
So, based on the above formula, the ROE for Otsuka is:
14% = JP¥54b ÷ JP¥375b (Based on the trailing twelve months to December 2024).
The 'return' is the yearly profit. Another way to think of that is that for every ¥1 worth of equity, the company was able to earn ¥0.14 in profit.
See our latest analysis for Otsuka
What Is The Relationship Between ROE And Earnings Growth?
We have already established that ROE serves as an efficient profit-generating gauge for a company's future earnings. Based on how much of its profits the company chooses to reinvest or "retain", we are then able to evaluate a company's future ability to generate profits. Assuming everything else remains unchanged, the higher the ROE and profit retention, the higher the growth rate of a company compared to companies that don't necessarily bear these characteristics.
Otsuka's Earnings Growth And 14% ROE
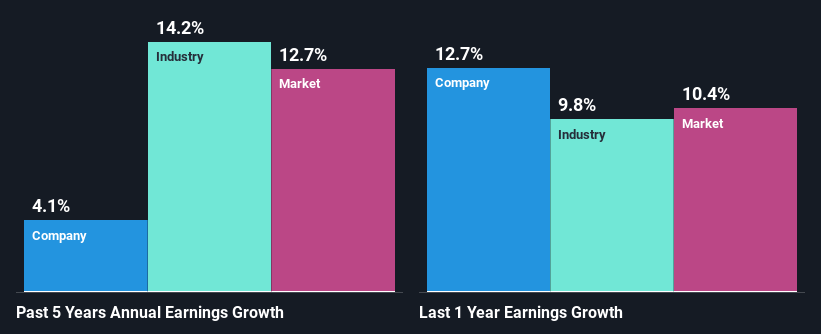
To begin with, Otsuka seems to have a respectable ROE. And on comparing with the industry, we found that the the average industry ROE is similar at 14%. Otsuka's decent returns aren't reflected in Otsuka'smediocre five year net income growth average of 4.1%. A few likely reasons that could be keeping earnings growth low are - the company has a high payout ratio or the business has allocated capital poorly, for instance.
As a next step, we compared Otsuka's net income growth with the industry and were disappointed to see that the company's growth is lower than the industry average growth of 14% in the same period.
Earnings growth is a huge factor in stock valuation. What investors need to determine next is if the expected earnings growth, or the lack of it, is already built into the share price. By doing so, they will have an idea if the stock is headed into clear blue waters or if swampy waters await. If you're wondering about Otsuka's's valuation, check out this gauge of its price-to-earnings ratio , as compared to its industry.
Is Otsuka Efficiently Re-investing Its Profits?
The high three-year median payout ratio of 55% (that is, the company retains only 45% of its income) over the past three years for Otsuka suggests that the company's earnings growth was lower as a result of paying out a majority of its earnings.
In addition, Otsuka has been paying dividends over a period of at least ten years suggesting that keeping up dividend payments is way more important to the management even if it comes at the cost of business growth.
Conclusion
Overall, we feel that Otsuka certainly does have some positive factors to consider. Although, we are disappointed to see a lack of growth in earnings even in spite of a high ROE. Bear in mind, the company reinvests a small portion of its profits, which means that investors aren't reaping the benefits of the high rate of return. That being so, the latest analyst forecasts show that the company will continue to see an expansion in its earnings. To know more about the latest analysts predictions for the company, check out this visualization of analyst forecasts for the company.
New: AI Stock Screener & Alerts
Our new AI Stock Screener scans the market every day to uncover opportunities.
• Dividend Powerhouses (3%+ Yield)
• Undervalued Small Caps with Insider Buying
• High growth Tech and AI Companies
Or build your own from over 50 metrics.
Have feedback on this article? Concerned about the content? Get in touch with us directly. Alternatively, email editorial-team (at) simplywallst.com.
This article by Simply Wall St is general in nature. We provide commentary based on historical data and analyst forecasts only using an unbiased methodology and our articles are not intended to be financial advice. It does not constitute a recommendation to buy or sell any stock, and does not take account of your objectives, or your financial situation. We aim to bring you long-term focused analysis driven by fundamental data. Note that our analysis may not factor in the latest price-sensitive company announcements or qualitative material. Simply Wall St has no position in any stocks mentioned.
About TSE:4768
Flawless balance sheet with proven track record and pays a dividend.
Market Insights


Advertisement
Community Narratives
For the Emperor: Why Games Workshop Could Be a Star Investment
Fair Value UK£160.00|0.4% undervalued
RO
Community Contributor
Securitas will boost margins with AI and tech-driven services
Fair Value SEK 260.91|45.0% undervalued
UN
Community Contributor
A Leader in EV Charging with Growth Potential
Fair Value €27.00|20.4% undervalued
TI
Community Contributor