
Advertisement
Warren Buffett famously said, 'Volatility is far from synonymous with risk.' When we think about how risky a company is, we always like to look at its use of debt, since debt overload can lead to ruin. We note that Sourcenext Corporation (TSE:4344) does have debt on its balance sheet. But is this debt a concern to shareholders?
We've discovered 2 warning signs about Sourcenext. View them for free.What Risk Does Debt Bring?
Debt assists a business until the business has trouble paying it off, either with new capital or with free cash flow. In the worst case scenario, a company can go bankrupt if it cannot pay its creditors. However, a more frequent (but still costly) occurrence is where a company must issue shares at bargain-basement prices, permanently diluting shareholders, just to shore up its balance sheet. Of course, debt can be an important tool in businesses, particularly capital heavy businesses. The first thing to do when considering how much debt a business uses is to look at its cash and debt together.
What Is Sourcenext's Debt?
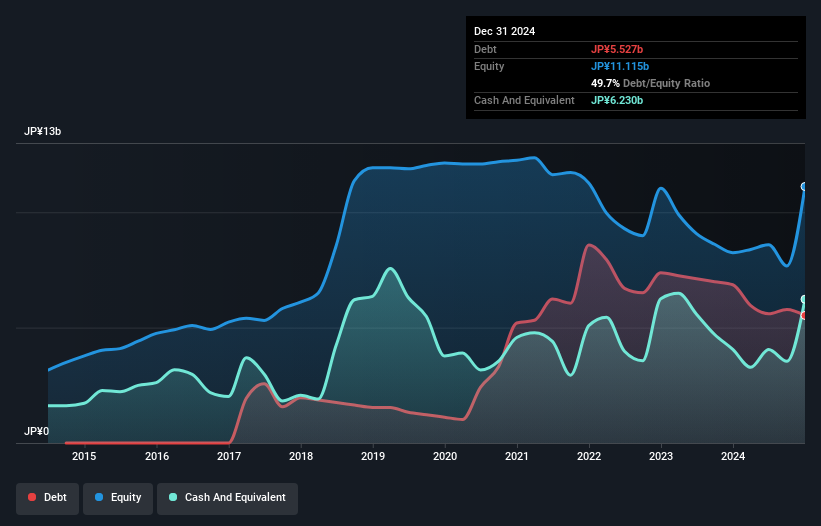
The image below, which you can click on for greater detail, shows that Sourcenext had debt of JP¥5.53b at the end of December 2024, a reduction from JP¥6.86b over a year. But it also has JP¥6.23b in cash to offset that, meaning it has JP¥703.0m net cash.
How Healthy Is Sourcenext's Balance Sheet?
Zooming in on the latest balance sheet data, we can see that Sourcenext had liabilities of JP¥6.58b due within 12 months and liabilities of JP¥1.74b due beyond that. Offsetting these obligations, it had cash of JP¥6.23b as well as receivables valued at JP¥1.49b due within 12 months. So it has liabilities totalling JP¥604.0m more than its cash and near-term receivables, combined.
Of course, Sourcenext has a market capitalization of JP¥23.5b, so these liabilities are probably manageable. Having said that, it's clear that we should continue to monitor its balance sheet, lest it change for the worse. Despite its noteworthy liabilities, Sourcenext boasts net cash, so it's fair to say it does not have a heavy debt load! The balance sheet is clearly the area to focus on when you are analysing debt. But you can't view debt in total isolation; since Sourcenext will need earnings to service that debt. So when considering debt, it's definitely worth looking at the earnings trend. Click here for an interactive snapshot.
Check out our latest analysis for Sourcenext
In the last year Sourcenext wasn't profitable at an EBIT level, but managed to grow its revenue by 9.2%, to JP¥12b. We usually like to see faster growth from unprofitable companies, but each to their own.
So How Risky Is Sourcenext?
Statistically speaking companies that lose money are riskier than those that make money. And in the last year Sourcenext had an earnings before interest and tax (EBIT) loss, truth be told. Indeed, in that time it burnt through JP¥2.0b of cash and made a loss of JP¥2.4b. But the saving grace is the JP¥703.0m on the balance sheet. That kitty means the company can keep spending for growth for at least two years, at current rates. Summing up, we're a little skeptical of this one, as it seems fairly risky in the absence of free cashflow. The balance sheet is clearly the area to focus on when you are analysing debt. However, not all investment risk resides within the balance sheet - far from it. For example - Sourcenext has 2 warning signs we think you should be aware of.
Of course, if you're the type of investor who prefers buying stocks without the burden of debt, then don't hesitate to discover our exclusive list of net cash growth stocks, today.
New: Manage All Your Stock Portfolios in One Place
We've created the ultimate portfolio companion for stock investors, and it's free.
• Connect an unlimited number of Portfolios and see your total in one currency
• Be alerted to new Warning Signs or Risks via email or mobile
• Track the Fair Value of your stocks
Have feedback on this article? Concerned about the content? Get in touch with us directly. Alternatively, email editorial-team (at) simplywallst.com.
This article by Simply Wall St is general in nature. We provide commentary based on historical data and analyst forecasts only using an unbiased methodology and our articles are not intended to be financial advice. It does not constitute a recommendation to buy or sell any stock, and does not take account of your objectives, or your financial situation. We aim to bring you long-term focused analysis driven by fundamental data. Note that our analysis may not factor in the latest price-sensitive company announcements or qualitative material. Simply Wall St has no position in any stocks mentioned.
About TSE:4344
Sourcenext
Develops and distributes various software products in Japan and internationally.
Excellent balance sheet and slightly overvalued.
Market Insights

Advertisement
Weekly Picks
WO

woodworthfund on MGP Ingredients ·
THE KINGDOM OF BROWN GOODS: WHY MGPI IS BEING CRUSHED BY INVENTORY & PRIMED FOR RESURRECTION
Fair Value:US$4034.1% undervalued
18 followersusers have followed this narrative
1 commentusers have commented on this narrative
4 likesusers have liked this narrative
DO


Double_Bubbler on Vertical Aerospace ·
Why Vertical Aerospace (NYSE: EVTL) is Worth Possibly Over 13x its Current Price
Fair Value:US$6090.0% undervalued
21 followersusers have followed this narrative
2 commentsusers have commented on this narrative
17 likesusers have liked this narrative
TI


TickerTickle on Oracle ·
The Quiet Giant That Became AI’s Power Grid
Fair Value:US$389.8142.8% undervalued
41 followersusers have followed this narrative
3 commentsusers have commented on this narrative
8 likesusers have liked this narrative
Recently Updated Narratives
MH


mhbb on Mastersystem Infotama ·
Mastersystem Infotama will achieve 18.9% revenue growth as fair value hits IDR1,650
Fair Value:Rp1.63k13.8% undervalued
1 followerusers have followed this narrative
0 commentsusers have commented on this narrative
0 likesusers have liked this narrative
RO


Robbo on Procter & Gamble ·
Insiders Sell, Investors Watch: What’s Going On at PG?
Fair Value:US$1506.8% undervalued
1 followerusers have followed this narrative
0 commentsusers have commented on this narrative
0 likesusers have liked this narrative
CW

Cwburton on Verano Holdings ·
Waiting for the Inevitable
Fair Value:CA$5.5278.8% undervalued
2 followersusers have followed this narrative
0 commentsusers have commented on this narrative
0 likesusers have liked this narrative
Popular Narratives
TH


TheWallstreetKing on MicroVision ·
MicroVision will explode future revenue by 380.37% with a vision towards success
Fair Value:US$6098.5% undervalued
119 followersusers have followed this narrative
11 commentsusers have commented on this narrative
22 likesusers have liked this narrative
AN


AnalystConsensusTarget on NVIDIA ·
NVDA: Expanding AI Demand Will Drive Major Data Center Investments Through 2026
Fair Value:US$250.3926.6% undervalued
962 followersusers have followed this narrative
6 commentsusers have commented on this narrative
25 likesusers have liked this narrative
RO


RockeTeller on Santacruz Silver Mining ·
Crazy Undervalued 42 Baggers Silver Play (Active & Running Mine)
Fair Value:CA$8684.3% undervalued
77 followersusers have followed this narrative
8 commentsusers have commented on this narrative
21 likesusers have liked this narrative
Trending Discussion

WA


Wane_Investment_House on FCMB Group ·
This aligns FCMB with global green finance standards and strengthens its attractiveness to impact investors. 4. Deepens Strategic Partnerships and International Collaboration The collaboration with FMO and HeaveVentures broadens FCMB’s relationship with: Development finance institutions (DFIs), Venture capital and innovation hubs, Global agri-value chain partners. These partnerships provide FCMB with: Access to co-financing opportunities, Technical expertise, Future pipeline collaboration, which collectively expands FCMB’s capacity to support complex and scalable agribusiness projects. 5. Builds a Pipeline for Future Lending, Investment, and Market Expansion The Hackathon serves as a feeder mechanism into FCMB’s broader agribusiness strategy by: Identifying innovative startups that can evolve into long-term borrowers or partners. Creating opportunities for structured financing, contract farming solutions, and supply-chain digitization. Enhancing FCMB’s advisory and merchant banking relevance in the agritech investment landscape. This creates a sustainable pipeline of bankable opportunities in a sector with high long-term growth potential. 6. Strengthens FCMB’s Brand Positioning and Competitive Advantage The initiative differentiates FCMB from peer institutions by: Showcasing its commitment to innovation-led economic transformation. Demonstrating leadership in supporting Nigeria’s food security agenda. Reinforcing customer loyalty in the SME and agribusiness segments. This positions FCMB as a future-ready financial partner with strong sectoral expertise and deep development impact. Strategic Outlook The FCMB AgriTech Hackathon 2025 is expected to deliver medium-to-long-term value by: Deepening FCMB’s market share in agribusiness finance, Enabling new digital lending frameworks, Strengthening ESG positioning, Expanding cross-border innovation partnerships, Supporting scalable agritech solutions capable of transforming Nigeria’s food system.
0
|0