More Unpleasant Surprises Could Be In Store For Asteria Corporation's (TSE:3853) Shares After Tumbling 27%

Unfortunately for some shareholders, the Asteria Corporation (TSE:3853) share price has dived 27% in the last thirty days, prolonging recent pain. The drop over the last 30 days has capped off a tough year for shareholders, with the share price down 37% in that time.
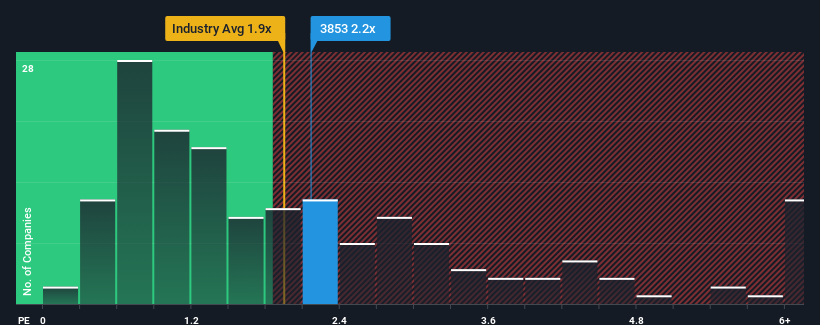
Although its price has dipped substantially, it's still not a stretch to say that Asteria's price-to-sales (or "P/S") ratio of 2.2x right now seems quite "middle-of-the-road" compared to the Software industry in Japan, where the median P/S ratio is around 1.9x. While this might not raise any eyebrows, if the P/S ratio is not justified investors could be missing out on a potential opportunity or ignoring looming disappointment.
See our latest analysis for Asteria
How Has Asteria Performed Recently?
For example, consider that Asteria's financial performance has been poor lately as its revenue has been in decline. One possibility is that the P/S is moderate because investors think the company might still do enough to be in line with the broader industry in the near future. If not, then existing shareholders may be a little nervous about the viability of the share price.
Want the full picture on earnings, revenue and cash flow for the company? Then our free report on Asteria will help you shine a light on its historical performance.How Is Asteria's Revenue Growth Trending?
The only time you'd be comfortable seeing a P/S like Asteria's is when the company's growth is tracking the industry closely.
Taking a look back first, the company's revenue growth last year wasn't something to get excited about as it posted a disappointing decline of 22%. This has soured the latest three-year period, which nevertheless managed to deliver a decent 9.6% overall rise in revenue. So we can start by confirming that the company has generally done a good job of growing revenue over that time, even though it had some hiccups along the way.
Comparing that to the industry, which is predicted to deliver 12% growth in the next 12 months, the company's momentum is weaker, based on recent medium-term annualised revenue results.
With this information, we find it interesting that Asteria is trading at a fairly similar P/S compared to the industry. It seems most investors are ignoring the fairly limited recent growth rates and are willing to pay up for exposure to the stock. They may be setting themselves up for future disappointment if the P/S falls to levels more in line with recent growth rates.
What We Can Learn From Asteria's P/S?
With its share price dropping off a cliff, the P/S for Asteria looks to be in line with the rest of the Software industry. Generally, our preference is to limit the use of the price-to-sales ratio to establishing what the market thinks about the overall health of a company.
We've established that Asteria's average P/S is a bit surprising since its recent three-year growth is lower than the wider industry forecast. When we see weak revenue with slower than industry growth, we suspect the share price is at risk of declining, bringing the P/S back in line with expectations. If recent medium-term revenue trends continue, the probability of a share price decline will become quite substantial, placing shareholders at risk.
You need to take note of risks, for example - Asteria has 3 warning signs (and 1 which is a bit unpleasant) we think you should know about.
Of course, profitable companies with a history of great earnings growth are generally safer bets. So you may wish to see this free collection of other companies that have reasonable P/E ratios and have grown earnings strongly.
The New Payments ETF Is Live on NASDAQ:
Money is moving to real-time rails, and a newly listed ETF now gives investors direct exposure. Fast settlement. Institutional custody. Simple access.
Explore how this launch could reshape portfolios
Sponsored ContentNew: Manage All Your Stock Portfolios in One Place
We've created the ultimate portfolio companion for stock investors, and it's free.
• Connect an unlimited number of Portfolios and see your total in one currency
• Be alerted to new Warning Signs or Risks via email or mobile
• Track the Fair Value of your stocks
Have feedback on this article? Concerned about the content? Get in touch with us directly. Alternatively, email editorial-team (at) simplywallst.com.
This article by Simply Wall St is general in nature. We provide commentary based on historical data and analyst forecasts only using an unbiased methodology and our articles are not intended to be financial advice. It does not constitute a recommendation to buy or sell any stock, and does not take account of your objectives, or your financial situation. We aim to bring you long-term focused analysis driven by fundamental data. Note that our analysis may not factor in the latest price-sensitive company announcements or qualitative material. Simply Wall St has no position in any stocks mentioned.
About TSE:3853
Flawless balance sheet with proven track record.
Market Insights

Weekly Picks

THE KINGDOM OF BROWN GOODS: WHY MGPI IS BEING CRUSHED BY INVENTORY & PRIMED FOR RESURRECTION


Why Vertical Aerospace (NYSE: EVTL) is Worth Possibly Over 13x its Current Price


The Quiet Giant That Became AI’s Power Grid
Recently Updated Narratives


MINISO's fair value is projected at 26.69 with an anticipated PE ratio shift of 20x

Fiverr International will transform the freelance industry with AI-powered growth

Jackson Financial Stock: When Insurance Math Meets a Shifting Claims Landscape
Popular Narratives


MicroVision will explode future revenue by 380.37% with a vision towards success


Crazy Undervalued 42 Baggers Silver Play (Active & Running Mine)


