
Some say volatility, rather than debt, is the best way to think about risk as an investor, but Warren Buffett famously said that 'Volatility is far from synonymous with risk.' When we think about how risky a company is, we always like to look at its use of debt, since debt overload can lead to ruin. Importantly, THE WHY HOW DO COMPANY, Inc. (TSE:3823) does carry debt. But is this debt a concern to shareholders?
When Is Debt A Problem?
Debt assists a business until the business has trouble paying it off, either with new capital or with free cash flow. If things get really bad, the lenders can take control of the business. However, a more usual (but still expensive) situation is where a company must dilute shareholders at a cheap share price simply to get debt under control. Of course, plenty of companies use debt to fund growth, without any negative consequences. When we think about a company's use of debt, we first look at cash and debt together.
See our latest analysis for WHY HOW DO COMPANY
What Is WHY HOW DO COMPANY's Net Debt?
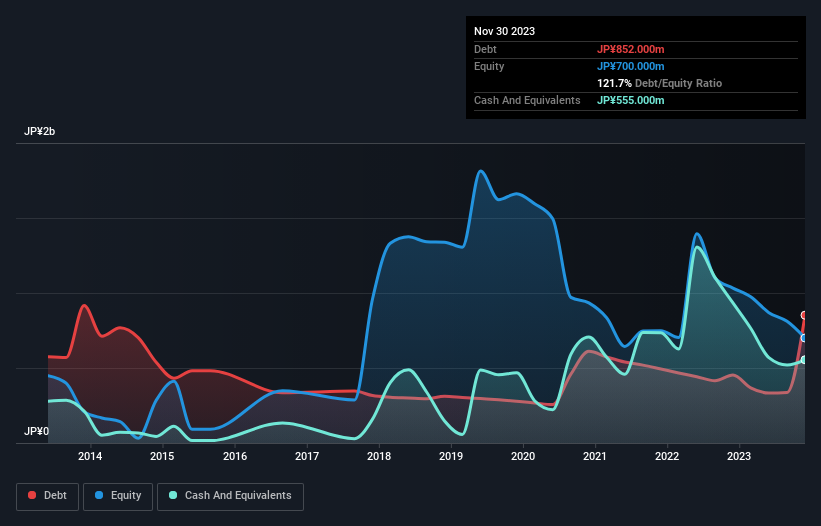
You can click the graphic below for the historical numbers, but it shows that as of November 2023 WHY HOW DO COMPANY had JP¥852.0m of debt, an increase on JP¥453.0m, over one year. However, it does have JP¥555.0m in cash offsetting this, leading to net debt of about JP¥297.0m.
How Strong Is WHY HOW DO COMPANY's Balance Sheet?
We can see from the most recent balance sheet that WHY HOW DO COMPANY had liabilities of JP¥475.0m falling due within a year, and liabilities of JP¥603.0m due beyond that. Offsetting this, it had JP¥555.0m in cash and JP¥245.0m in receivables that were due within 12 months. So its liabilities total JP¥278.0m more than the combination of its cash and short-term receivables.
Of course, WHY HOW DO COMPANY has a market capitalization of JP¥2.03b, so these liabilities are probably manageable. Having said that, it's clear that we should continue to monitor its balance sheet, lest it change for the worse. The balance sheet is clearly the area to focus on when you are analysing debt. But it is WHY HOW DO COMPANY's earnings that will influence how the balance sheet holds up in the future. So if you're keen to discover more about its earnings, it might be worth checking out this graph of its long term earnings trend.
Over 12 months, WHY HOW DO COMPANY saw its revenue hold pretty steady, and it did not report positive earnings before interest and tax. While that's not too bad, we'd prefer see growth.
Caveat Emptor
Importantly, WHY HOW DO COMPANY had an earnings before interest and tax (EBIT) loss over the last year. Its EBIT loss was a whopping JP¥287m. When we look at that and recall the liabilities on its balance sheet, relative to cash, it seems unwise to us for the company to have any debt. Quite frankly we think the balance sheet is far from match-fit, although it could be improved with time. However, it doesn't help that it burned through JP¥420m of cash over the last year. So in short it's a really risky stock. When analysing debt levels, the balance sheet is the obvious place to start. However, not all investment risk resides within the balance sheet - far from it. For example, we've discovered 4 warning signs for WHY HOW DO COMPANY (2 are significant!) that you should be aware of before investing here.
At the end of the day, it's often better to focus on companies that are free from net debt. You can access our special list of such companies (all with a track record of profit growth). It's free.
Mobile Infrastructure for Defense and Disaster
The next wave in robotics isn't humanoid. Its fully autonomous towers delivering 5G, ISR, and radar in under 30 minutes, anywhere.
Get the investor briefing before the next round of contracts
Sponsored On Behalf of CiTechValuation is complex, but we're here to simplify it.
Discover if WHY HOW DO COMPANY might be undervalued or overvalued with our detailed analysis, featuring fair value estimates, potential risks, dividends, insider trades, and its financial condition.
Access Free AnalysisHave feedback on this article? Concerned about the content? Get in touch with us directly. Alternatively, email editorial-team (at) simplywallst.com.
This article by Simply Wall St is general in nature. We provide commentary based on historical data and analyst forecasts only using an unbiased methodology and our articles are not intended to be financial advice. It does not constitute a recommendation to buy or sell any stock, and does not take account of your objectives, or your financial situation. We aim to bring you long-term focused analysis driven by fundamental data. Note that our analysis may not factor in the latest price-sensitive company announcements or qualitative material. Simply Wall St has no position in any stocks mentioned.
About TSE:3823
WHY HOW DO COMPANY
Provides services and solutions for smartphones in Japan.
Flawless balance sheet with low risk.
Market Insights

Weekly Picks

THE KINGDOM OF BROWN GOODS: WHY MGPI IS BEING CRUSHED BY INVENTORY & PRIMED FOR RESURRECTION


Why Vertical Aerospace (NYSE: EVTL) is Worth Possibly Over 13x its Current Price


The Quiet Giant That Became AI’s Power Grid
Recently Updated Narratives


Fiverr International will transform the freelance industry with AI-powered growth

Jackson Financial Stock: When Insurance Math Meets a Shifting Claims Landscape

Stride Stock: Online Education Finds Its Second Act
Popular Narratives


MicroVision will explode future revenue by 380.37% with a vision towards success


Crazy Undervalued 42 Baggers Silver Play (Active & Running Mine)


NVDA: Expanding AI Demand Will Drive Major Data Center Investments Through 2026
Trending Discussion
<html><head></head><body><div dir="auto">This is true here, but always true in the case of Alpha leaders. Often is takes a turn or two to get it right, like Gates to Nardella,  or Anton to Pinchar. This is when succession planning has failed or never happened. </div><div><br></div> </body></html>