We Think That There Are Some Issues For ASJ (TSE:2351) Beyond Its Promising Earnings

ASJ Inc.'s (TSE:2351 ) stock didn't jump after it announced some healthy earnings. Our analysis showed that there are some concerning factors in the earnings that investors may be cautious of.
Our free stock report includes 3 warning signs investors should be aware of before investing in ASJ. Read for free now.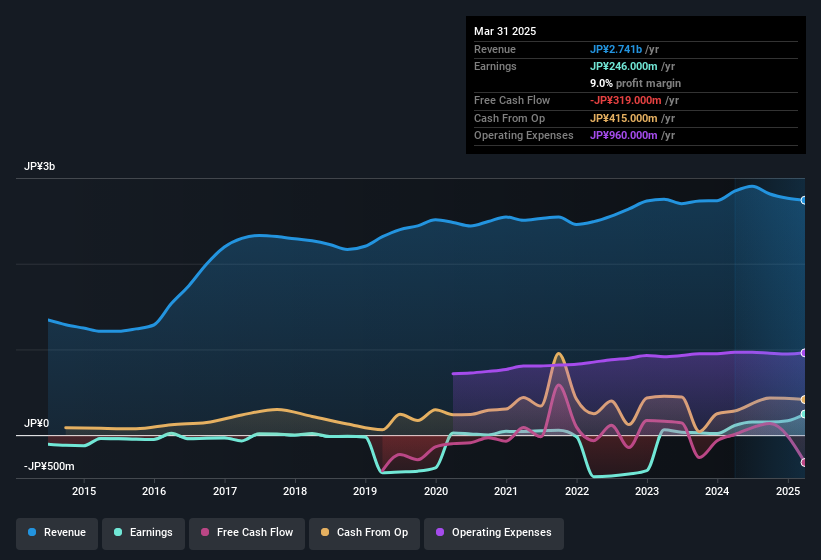
Zooming In On ASJ's Earnings
In high finance, the key ratio used to measure how well a company converts reported profits into free cash flow (FCF) is the accrual ratio (from cashflow). To get the accrual ratio we first subtract FCF from profit for a period, and then divide that number by the average operating assets for the period. The ratio shows us how much a company's profit exceeds its FCF.
Therefore, it's actually considered a good thing when a company has a negative accrual ratio, but a bad thing if its accrual ratio is positive. While it's not a problem to have a positive accrual ratio, indicating a certain level of non-cash profits, a high accrual ratio is arguably a bad thing, because it indicates paper profits are not matched by cash flow. To quote a 2014 paper by Lewellen and Resutek, "firms with higher accruals tend to be less profitable in the future".
For the year to March 2025, ASJ had an accrual ratio of 0.25. Unfortunately, that means its free cash flow fell significantly short of its reported profits. Over the last year it actually had negative free cash flow of JP¥319m, in contrast to the aforementioned profit of JP¥246.0m. It's worth noting that ASJ generated positive FCF of JP¥8.0m a year ago, so at least they've done it in the past. However, as we will discuss below, we can see that the company's accrual ratio has been impacted by its tax situation. This would partially explain why the accrual ratio was so poor.
Note: we always recommend investors check balance sheet strength. Click here to be taken to our balance sheet analysis of ASJ.
An Unusual Tax Situation
Moving on from the accrual ratio, we note that ASJ profited from a tax benefit which contributed JP¥82m to profit. This is meaningful because companies usually pay tax rather than receive tax benefits. We're sure the company was pleased with its tax benefit. However, the devil in the detail is that these kind of benefits only impact in the year they are booked, and are often one-off in nature. Assuming the tax benefit is not repeated every year, we could see its profitability drop noticeably, all else being equal.
Our Take On ASJ's Profit Performance
ASJ's accrual ratio indicates weak cashflow relative to earnings, which perhaps arises in part from the tax benefit it received this year. If the tax benefit is not repeated, then profit would drop next year, all else being equal. For the reasons mentioned above, we think that a perfunctory glance at ASJ's statutory profits might make it look better than it really is on an underlying level. Keep in mind, when it comes to analysing a stock it's worth noting the risks involved. Be aware that ASJ is showing 3 warning signs in our investment analysis and 1 of those is potentially serious...
In this article we've looked at a number of factors that can impair the utility of profit numbers, and we've come away cautious. But there is always more to discover if you are capable of focussing your mind on minutiae. For example, many people consider a high return on equity as an indication of favorable business economics, while others like to 'follow the money' and search out stocks that insiders are buying. So you may wish to see this free collection of companies boasting high return on equity, or this list of stocks with high insider ownership.
The New Payments ETF Is Live on NASDAQ:
Money is moving to real-time rails, and a newly listed ETF now gives investors direct exposure. Fast settlement. Institutional custody. Simple access.
Explore how this launch could reshape portfolios
Sponsored ContentNew: Manage All Your Stock Portfolios in One Place
We've created the ultimate portfolio companion for stock investors, and it's free.
• Connect an unlimited number of Portfolios and see your total in one currency
• Be alerted to new Warning Signs or Risks via email or mobile
• Track the Fair Value of your stocks
Have feedback on this article? Concerned about the content? Get in touch with us directly. Alternatively, email editorial-team (at) simplywallst.com.
This article by Simply Wall St is general in nature. We provide commentary based on historical data and analyst forecasts only using an unbiased methodology and our articles are not intended to be financial advice. It does not constitute a recommendation to buy or sell any stock, and does not take account of your objectives, or your financial situation. We aim to bring you long-term focused analysis driven by fundamental data. Note that our analysis may not factor in the latest price-sensitive company announcements or qualitative material. Simply Wall St has no position in any stocks mentioned.
About TSE:2351
ASJ
Engages in the setting up and management of servers on the Internet in Japan.
Excellent balance sheet with proven track record.
Market Insights

Weekly Picks

THE KINGDOM OF BROWN GOODS: WHY MGPI IS BEING CRUSHED BY INVENTORY & PRIMED FOR RESURRECTION


Why Vertical Aerospace (NYSE: EVTL) is Worth Possibly Over 13x its Current Price


The Quiet Giant That Became AI’s Power Grid
Recently Updated Narratives
Why Vertical Aerospace (NYSE: EVTL) is Worth Possibly Over 13x its Current Price

Deep Value Multi Bagger Opportunity


A case for CA$31.80 (undiluted), aka 8,616% upside from CA$0.37 (an 86 bagger!).
Popular Narratives


MicroVision will explode future revenue by 380.37% with a vision towards success


Crazy Undervalued 42 Baggers Silver Play (Active & Running Mine)


