- Japan
- /
- Semiconductors
- /
- TSE:6857
Advantest's (TSE:6857) five-year earnings growth trails the 43% YoY shareholder returns


While Advantest Corporation (TSE:6857) shareholders are probably generally happy, the stock hasn't had particularly good run recently, with the share price falling 20% in the last quarter. But that doesn't undermine the fantastic longer term performance (measured over five years). To be precise, the stock price is 460% higher than it was five years ago, a wonderful performance by any measure. Arguably, the recent fall is to be expected after such a strong rise. Only time will tell if there is still too much optimism currently reflected in the share price.
Since it's been a strong week for Advantest shareholders, let's have a look at trend of the longer term fundamentals.
Our free stock report includes 1 warning sign investors should be aware of before investing in Advantest. Read for free now.While the efficient markets hypothesis continues to be taught by some, it has been proven that markets are over-reactive dynamic systems, and investors are not always rational. By comparing earnings per share (EPS) and share price changes over time, we can get a feel for how investor attitudes to a company have morphed over time.
Over half a decade, Advantest managed to grow its earnings per share at 27% a year. This EPS growth is slower than the share price growth of 41% per year, over the same period. So it's fair to assume the market has a higher opinion of the business than it did five years ago. And that's hardly shocking given the track record of growth.
You can see below how EPS has changed over time (discover the exact values by clicking on the image).
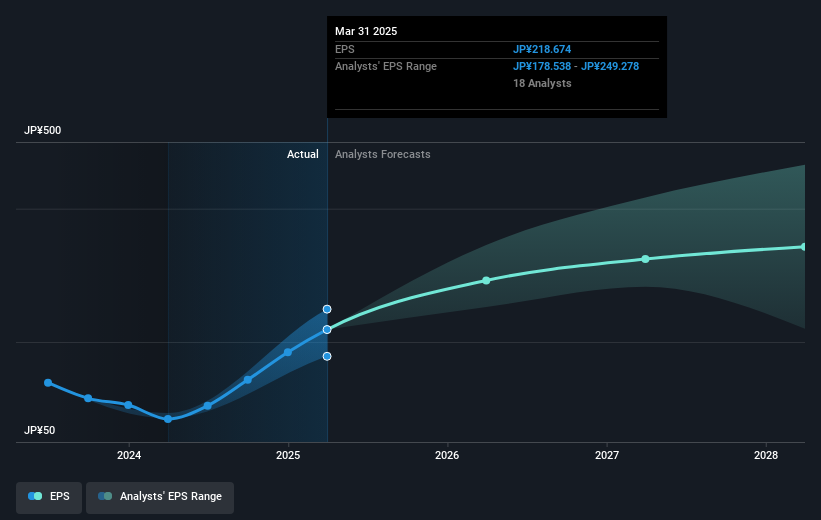
We know that Advantest has improved its bottom line lately, but is it going to grow revenue? This free report showing analyst revenue forecasts should help you figure out if the EPS growth can be sustained.
What About Dividends?
As well as measuring the share price return, investors should also consider the total shareholder return (TSR). The TSR incorporates the value of any spin-offs or discounted capital raisings, along with any dividends, based on the assumption that the dividends are reinvested. It's fair to say that the TSR gives a more complete picture for stocks that pay a dividend. As it happens, Advantest's TSR for the last 5 years was 491%, which exceeds the share price return mentioned earlier. The dividends paid by the company have thusly boosted the total shareholder return.
A Different Perspective
We're pleased to report that Advantest shareholders have received a total shareholder return of 37% over one year. And that does include the dividend. However, the TSR over five years, coming in at 43% per year, is even more impressive. I find it very interesting to look at share price over the long term as a proxy for business performance. But to truly gain insight, we need to consider other information, too. To that end, you should be aware of the 1 warning sign we've spotted with Advantest .
For those who like to find winning investments this free list of undervalued companies with recent insider purchasing, could be just the ticket.
Please note, the market returns quoted in this article reflect the market weighted average returns of stocks that currently trade on Japanese exchanges.
If you're looking to trade Advantest, open an account with the lowest-cost platform trusted by professionals, Interactive Brokers.
With clients in over 200 countries and territories, and access to 160 markets, IBKR lets you trade stocks, options, futures, forex, bonds and funds from a single integrated account.
Enjoy no hidden fees, no account minimums, and FX conversion rates as low as 0.03%, far better than what most brokers offer.
Sponsored ContentNew: Manage All Your Stock Portfolios in One Place
We've created the ultimate portfolio companion for stock investors, and it's free.
• Connect an unlimited number of Portfolios and see your total in one currency
• Be alerted to new Warning Signs or Risks via email or mobile
• Track the Fair Value of your stocks
Have feedback on this article? Concerned about the content? Get in touch with us directly. Alternatively, email editorial-team (at) simplywallst.com.
This article by Simply Wall St is general in nature. We provide commentary based on historical data and analyst forecasts only using an unbiased methodology and our articles are not intended to be financial advice. It does not constitute a recommendation to buy or sell any stock, and does not take account of your objectives, or your financial situation. We aim to bring you long-term focused analysis driven by fundamental data. Note that our analysis may not factor in the latest price-sensitive company announcements or qualitative material. Simply Wall St has no position in any stocks mentioned.
About TSE:6857
Advantest
Manufactures and sells semiconductors, component test system products, and mechatronics related products in Japan, the Americas, Europe, and Asia.
Outstanding track record with excellent balance sheet.
Similar Companies
Market Insights

Community Narratives


