
Advertisement
- Japan
- /
- Semiconductors
- /
- TSE:6590
Are Robust Financials Driving The Recent Rally In Shibaura Mechatronics Corporation's (TSE:6590) Stock?
Most readers would already be aware that Shibaura Mechatronics' (TSE:6590) stock increased significantly by 28% over the past month. Given that the market rewards strong financials in the long-term, we wonder if that is the case in this instance. Specifically, we decided to study Shibaura Mechatronics' ROE in this article.
Return on equity or ROE is a key measure used to assess how efficiently a company's management is utilizing the company's capital. In other words, it is a profitability ratio which measures the rate of return on the capital provided by the company's shareholders.
See our latest analysis for Shibaura Mechatronics
How Is ROE Calculated?
The formula for return on equity is:
Return on Equity = Net Profit (from continuing operations) ÷ Shareholders' Equity
So, based on the above formula, the ROE for Shibaura Mechatronics is:
24% = JP¥9.3b ÷ JP¥39b (Based on the trailing twelve months to June 2024).
The 'return' is the income the business earned over the last year. So, this means that for every ¥1 of its shareholder's investments, the company generates a profit of ¥0.24.
What Is The Relationship Between ROE And Earnings Growth?
Thus far, we have learned that ROE measures how efficiently a company is generating its profits. Depending on how much of these profits the company reinvests or "retains", and how effectively it does so, we are then able to assess a company’s earnings growth potential. Assuming everything else remains unchanged, the higher the ROE and profit retention, the higher the growth rate of a company compared to companies that don't necessarily bear these characteristics.
A Side By Side comparison of Shibaura Mechatronics' Earnings Growth And 24% ROE
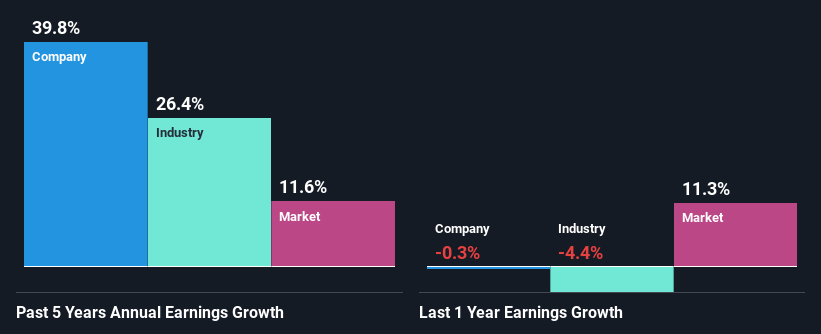
Firstly, we acknowledge that Shibaura Mechatronics has a significantly high ROE. Additionally, the company's ROE is higher compared to the industry average of 12% which is quite remarkable. Under the circumstances, Shibaura Mechatronics' considerable five year net income growth of 40% was to be expected.
As a next step, we compared Shibaura Mechatronics' net income growth with the industry, and pleasingly, we found that the growth seen by the company is higher than the average industry growth of 26%.
Earnings growth is a huge factor in stock valuation. What investors need to determine next is if the expected earnings growth, or the lack of it, is already built into the share price. Doing so will help them establish if the stock's future looks promising or ominous. Has the market priced in the future outlook for 6590? You can find out in our latest intrinsic value infographic research report.
Is Shibaura Mechatronics Using Its Retained Earnings Effectively?
Shibaura Mechatronics has a three-year median payout ratio of 27% (where it is retaining 73% of its income) which is not too low or not too high. So it seems that Shibaura Mechatronics is reinvesting efficiently in a way that it sees impressive growth in its earnings (discussed above) and pays a dividend that's well covered.
Besides, Shibaura Mechatronics has been paying dividends for at least ten years or more. This shows that the company is committed to sharing profits with its shareholders.
Conclusion
On the whole, we feel that Shibaura Mechatronics' performance has been quite good. Specifically, we like that the company is reinvesting a huge chunk of its profits at a high rate of return. This of course has caused the company to see substantial growth in its earnings. Having said that, the company's earnings growth is expected to slow down, as forecasted in the current analyst estimates. To know more about the company's future earnings growth forecasts take a look at this free report on analyst forecasts for the company to find out more.
New: Manage All Your Stock Portfolios in One Place
We've created the ultimate portfolio companion for stock investors, and it's free.
• Connect an unlimited number of Portfolios and see your total in one currency
• Be alerted to new Warning Signs or Risks via email or mobile
• Track the Fair Value of your stocks
Have feedback on this article? Concerned about the content? Get in touch with us directly. Alternatively, email editorial-team (at) simplywallst.com.
This article by Simply Wall St is general in nature. We provide commentary based on historical data and analyst forecasts only using an unbiased methodology and our articles are not intended to be financial advice. It does not constitute a recommendation to buy or sell any stock, and does not take account of your objectives, or your financial situation. We aim to bring you long-term focused analysis driven by fundamental data. Note that our analysis may not factor in the latest price-sensitive company announcements or qualitative material. Simply Wall St has no position in any stocks mentioned.
About TSE:6590
Shibaura Mechatronics
Produces and sells manufacturing equipment for flat panel displays (FPDs), semiconductors, and electronic components in Japan, Northeastern Asia, and internationally.
Flawless balance sheet with proven track record.
Market Insights

Advertisement
Community Narratives
A formidable player in AI and enterprise computing.
Fair Value US$210.00|12.2% overvalued
CO
Community Contributor
IREN's Bold Moves in Sustainable Bitcoin Mining & AI Data Centers
Fair Value US$72.52|17.1% undervalued
BL
Community Contributor
Cooling the Champions: The Aussie Tech Behind F1's Victories
Fair Value AU$12.40|38.7% undervalued
TR
Community Contributor