
Advertisement
- Japan
- /
- Semiconductors
- /
- TSE:3856
Abalance Corporation (TSE:3856) Soars 61% But It's A Story Of Risk Vs Reward
Despite an already strong run, Abalance Corporation (TSE:3856) shares have been powering on, with a gain of 61% in the last thirty days. While recent buyers may be laughing, long-term holders might not be as pleased since the recent gain only brings the stock back to where it started a year ago.
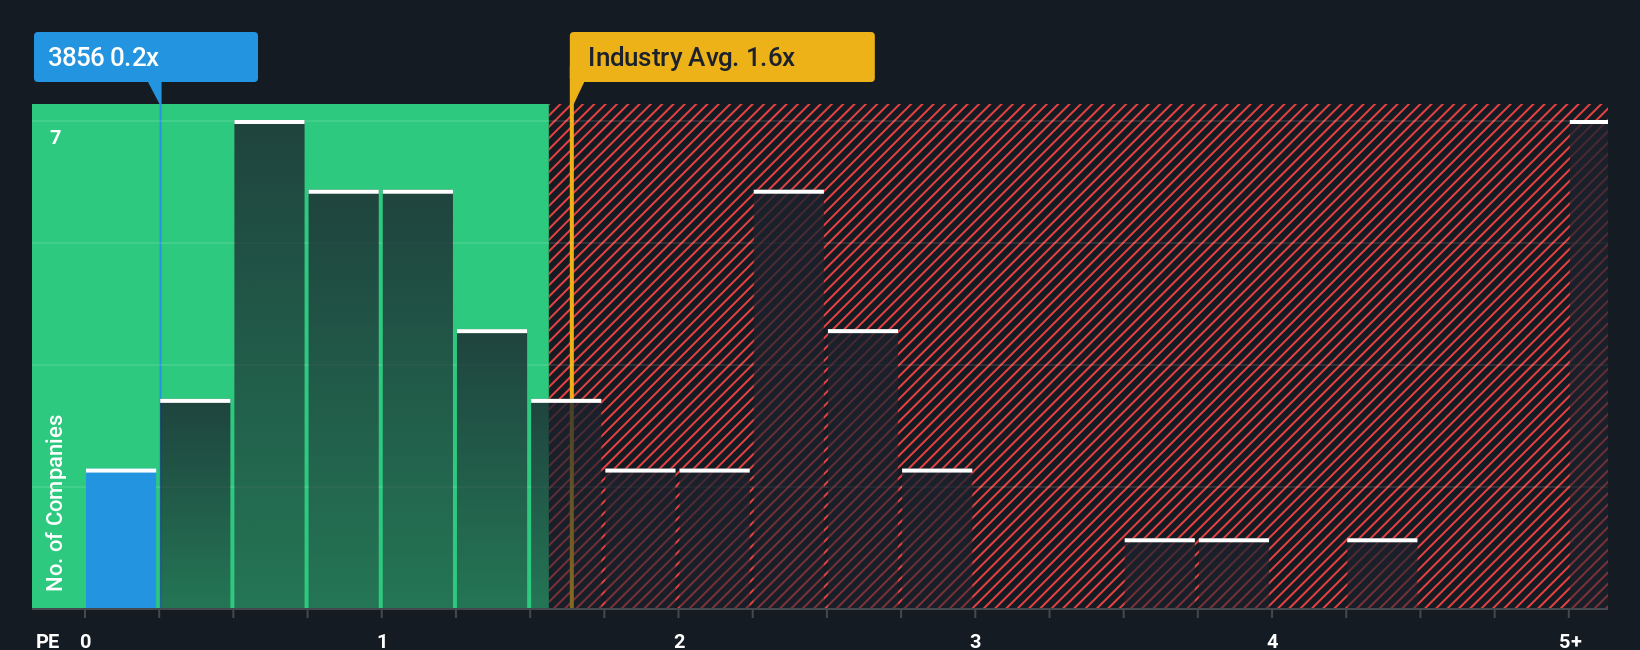
Although its price has surged higher, given about half the companies operating in Japan's Semiconductor industry have price-to-sales ratios (or "P/S") above 1.6x, you may still consider Abalance as an attractive investment with its 0.2x P/S ratio. Nonetheless, we'd need to dig a little deeper to determine if there is a rational basis for the reduced P/S.
See our latest analysis for Abalance
What Does Abalance's P/S Mean For Shareholders?
For instance, Abalance's receding revenue in recent times would have to be some food for thought. Perhaps the market believes the recent revenue performance isn't good enough to keep up the industry, causing the P/S ratio to suffer. Those who are bullish on Abalance will be hoping that this isn't the case so that they can pick up the stock at a lower valuation.
Although there are no analyst estimates available for Abalance, take a look at this free data-rich visualisation to see how the company stacks up on earnings, revenue and cash flow.What Are Revenue Growth Metrics Telling Us About The Low P/S?
The only time you'd be truly comfortable seeing a P/S as low as Abalance's is when the company's growth is on track to lag the industry.
Retrospectively, the last year delivered a frustrating 54% decrease to the company's top line. However, a few very strong years before that means that it was still able to grow revenue by an impressive 54% in total over the last three years. So we can start by confirming that the company has generally done a very good job of growing revenue over that time, even though it had some hiccups along the way.
This is in contrast to the rest of the industry, which is expected to grow by 3.2% over the next year, materially lower than the company's recent medium-term annualised growth rates.
In light of this, it's peculiar that Abalance's P/S sits below the majority of other companies. Apparently some shareholders believe the recent performance has exceeded its limits and have been accepting significantly lower selling prices.
The Final Word
Despite Abalance's share price climbing recently, its P/S still lags most other companies. We'd say the price-to-sales ratio's power isn't primarily as a valuation instrument but rather to gauge current investor sentiment and future expectations.
We're very surprised to see Abalance currently trading on a much lower than expected P/S since its recent three-year growth is higher than the wider industry forecast. Potential investors that are sceptical over continued revenue performance may be preventing the P/S ratio from matching previous strong performance. While recent revenue trends over the past medium-term suggest that the risk of a price decline is low, investors appear to perceive a likelihood of revenue fluctuations in the future.
It is also worth noting that we have found 3 warning signs for Abalance (2 are a bit concerning!) that you need to take into consideration.
It's important to make sure you look for a great company, not just the first idea you come across. So if growing profitability aligns with your idea of a great company, take a peek at this free list of interesting companies with strong recent earnings growth (and a low P/E).
New: Manage All Your Stock Portfolios in One Place
We've created the ultimate portfolio companion for stock investors, and it's free.
• Connect an unlimited number of Portfolios and see your total in one currency
• Be alerted to new Warning Signs or Risks via email or mobile
• Track the Fair Value of your stocks
Have feedback on this article? Concerned about the content? Get in touch with us directly. Alternatively, email editorial-team (at) simplywallst.com.
This article by Simply Wall St is general in nature. We provide commentary based on historical data and analyst forecasts only using an unbiased methodology and our articles are not intended to be financial advice. It does not constitute a recommendation to buy or sell any stock, and does not take account of your objectives, or your financial situation. We aim to bring you long-term focused analysis driven by fundamental data. Note that our analysis may not factor in the latest price-sensitive company announcements or qualitative material. Simply Wall St has no position in any stocks mentioned.
About TSE:3856
Abalance
Engages in renewable energy, construction machinary, IT, and photocatalyst businesses in Japan.
Excellent balance sheet with low risk.
Market Insights


Advertisement
Community Narratives
America Wants Homegrown Drones — Draganfly Is Ready to Deliver
Fair Value US$9.21|27.4% undervalued
JO
Community Contributor
Cheesecake Factory offers an enticing opportunity for long-term growth by leveraging new concepts
Fair Value US$73.83|25.8% undervalued
ZW
Community Contributor
Coca-Cola’s Intrinsic Value Set to Rise with Fed Rate Cut
Fair Value US$67.50|2.7% undervalued
AL
Community Contributor
Fully Permitted Gold Mine with 50 Baggers Potential 
Fair Value CA$41.00|98.0% undervalued
RO
Community Contributor