- Japan
- /
- Specialty Stores
- /
- TSE:7564
WorkmanLtd (TSE:7564) stock falls 4.9% in past week as five-year earnings and shareholder returns continue downward trend


For many, the main point of investing is to generate higher returns than the overall market. But even the best stock picker will only win with some selections. At this point some shareholders may be questioning their investment in Workman Co.,Ltd. (TSE:7564), since the last five years saw the share price fall 52%.
With the stock having lost 4.9% in the past week, it's worth taking a look at business performance and seeing if there's any red flags.
See our latest analysis for WorkmanLtd
In his essay The Superinvestors of Graham-and-Doddsville Warren Buffett described how share prices do not always rationally reflect the value of a business. One way to examine how market sentiment has changed over time is to look at the interaction between a company's share price and its earnings per share (EPS).
During the five years over which the share price declined, WorkmanLtd's earnings per share (EPS) dropped by 7.6% each year. Readers should note that the share price has fallen faster than the EPS, at a rate of 14% per year, over the period. So it seems the market was too confident about the business, in the past.
The company's earnings per share (over time) is depicted in the image below (click to see the exact numbers).
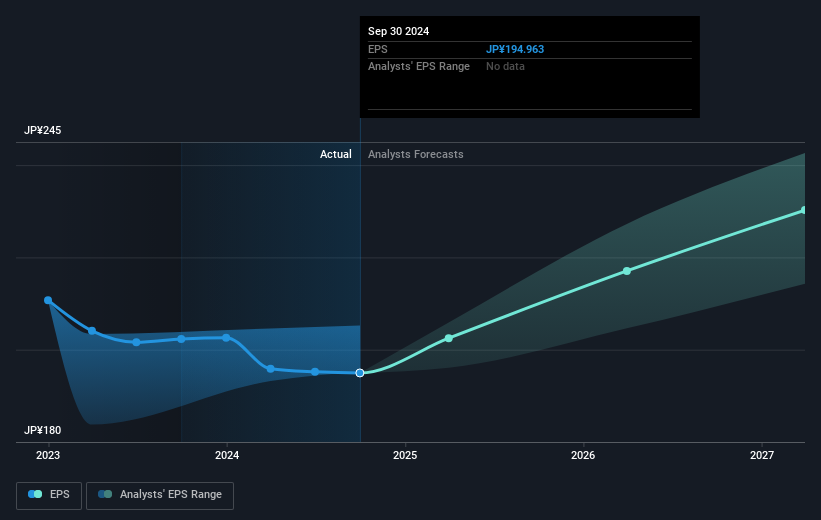
Before buying or selling a stock, we always recommend a close examination of historic growth trends, available here.
What About Dividends?
It is important to consider the total shareholder return, as well as the share price return, for any given stock. Whereas the share price return only reflects the change in the share price, the TSR includes the value of dividends (assuming they were reinvested) and the benefit of any discounted capital raising or spin-off. So for companies that pay a generous dividend, the TSR is often a lot higher than the share price return. We note that for WorkmanLtd the TSR over the last 5 years was -49%, which is better than the share price return mentioned above. The dividends paid by the company have thusly boosted the total shareholder return.
A Different Perspective
WorkmanLtd provided a TSR of 5.9% over the last twelve months. But that was short of the market average. On the bright side, that's still a gain, and it is certainly better than the yearly loss of about 8% endured over half a decade. It could well be that the business is stabilizing. Before deciding if you like the current share price, check how WorkmanLtd scores on these 3 valuation metrics.
If you would prefer to check out another company -- one with potentially superior financials -- then do not miss this free list of companies that have proven they can grow earnings.
Please note, the market returns quoted in this article reflect the market weighted average returns of stocks that currently trade on Japanese exchanges.
Valuation is complex, but we're here to simplify it.
Discover if WorkmanLtd might be undervalued or overvalued with our detailed analysis, featuring fair value estimates, potential risks, dividends, insider trades, and its financial condition.
Access Free AnalysisHave feedback on this article? Concerned about the content? Get in touch with us directly. Alternatively, email editorial-team (at) simplywallst.com.
This article by Simply Wall St is general in nature. We provide commentary based on historical data and analyst forecasts only using an unbiased methodology and our articles are not intended to be financial advice. It does not constitute a recommendation to buy or sell any stock, and does not take account of your objectives, or your financial situation. We aim to bring you long-term focused analysis driven by fundamental data. Note that our analysis may not factor in the latest price-sensitive company announcements or qualitative material. Simply Wall St has no position in any stocks mentioned.
About TSE:7564
Flawless balance sheet with limited growth.
Market Insights

Community Narratives


