
Advertisement
- Japan
- /
- Retail Distributors
- /
- TSE:7552
Happinet Corporation's (TSE:7552) Stock Has Been Sliding But Fundamentals Look Strong: Is The Market Wrong?

With its stock down 9.5% over the past week, it is easy to disregard Happinet (TSE:7552). However, a closer look at its sound financials might cause you to think again. Given that fundamentals usually drive long-term market outcomes, the company is worth looking at. Particularly, we will be paying attention to Happinet's ROE today.
Return on equity or ROE is an important factor to be considered by a shareholder because it tells them how effectively their capital is being reinvested. In short, ROE shows the profit each dollar generates with respect to its shareholder investments.
View our latest analysis for Happinet
How To Calculate Return On Equity?
ROE can be calculated by using the formula:
Return on Equity = Net Profit (from continuing operations) ÷ Shareholders' Equity
So, based on the above formula, the ROE for Happinet is:
11% = JP¥6.2b ÷ JP¥54b (Based on the trailing twelve months to December 2024).
The 'return' is the profit over the last twelve months. So, this means that for every ¥1 of its shareholder's investments, the company generates a profit of ¥0.11.
Why Is ROE Important For Earnings Growth?
So far, we've learned that ROE is a measure of a company's profitability. Based on how much of its profits the company chooses to reinvest or "retain", we are then able to evaluate a company's future ability to generate profits. Assuming all else is equal, companies that have both a higher return on equity and higher profit retention are usually the ones that have a higher growth rate when compared to companies that don't have the same features.
Happinet's Earnings Growth And 11% ROE
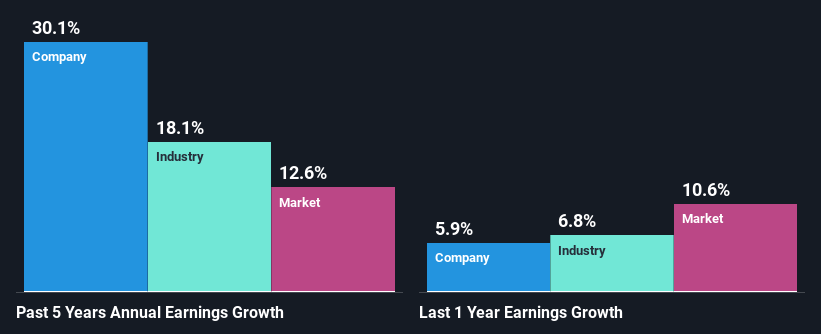
To begin with, Happinet seems to have a respectable ROE. Especially when compared to the industry average of 6.8% the company's ROE looks pretty impressive. This probably laid the ground for Happinet's significant 30% net income growth seen over the past five years. We believe that there might also be other aspects that are positively influencing the company's earnings growth. Such as - high earnings retention or an efficient management in place.
As a next step, we compared Happinet's net income growth with the industry, and pleasingly, we found that the growth seen by the company is higher than the average industry growth of 18%.
Earnings growth is an important metric to consider when valuing a stock. It’s important for an investor to know whether the market has priced in the company's expected earnings growth (or decline). This then helps them determine if the stock is placed for a bright or bleak future. One good indicator of expected earnings growth is the P/E ratio which determines the price the market is willing to pay for a stock based on its earnings prospects. So, you may want to check if Happinet is trading on a high P/E or a low P/E, relative to its industry.
Is Happinet Efficiently Re-investing Its Profits?
Happinet's three-year median payout ratio is a pretty moderate 39%, meaning the company retains 61% of its income. So it seems that Happinet is reinvesting efficiently in a way that it sees impressive growth in its earnings (discussed above) and pays a dividend that's well covered.
Moreover, Happinet is determined to keep sharing its profits with shareholders which we infer from its long history of paying a dividend for at least ten years.
Summary
Overall, we are quite pleased with Happinet's performance. In particular, it's great to see that the company is investing heavily into its business and along with a high rate of return, that has resulted in a sizeable growth in its earnings. If the company continues to grow its earnings the way it has, that could have a positive impact on its share price given how earnings per share influence long-term share prices. Remember, the price of a stock is also dependent on the perceived risk. Therefore investors must keep themselves informed about the risks involved before investing in any company. You can see the 2 risks we have identified for Happinet by visiting our risks dashboard for free on our platform here.
Valuation is complex, but we're here to simplify it.
Discover if Happinet might be undervalued or overvalued with our detailed analysis, featuring fair value estimates, potential risks, dividends, insider trades, and its financial condition.
Access Free AnalysisHave feedback on this article? Concerned about the content? Get in touch with us directly. Alternatively, email editorial-team (at) simplywallst.com.
This article by Simply Wall St is general in nature. We provide commentary based on historical data and analyst forecasts only using an unbiased methodology and our articles are not intended to be financial advice. It does not constitute a recommendation to buy or sell any stock, and does not take account of your objectives, or your financial situation. We aim to bring you long-term focused analysis driven by fundamental data. Note that our analysis may not factor in the latest price-sensitive company announcements or qualitative material. Simply Wall St has no position in any stocks mentioned.
About TSE:7552
Flawless balance sheet average dividend payer.
Market Insights

Advertisement
Community Narratives
Enterprise, AI & Cloud Growth Ahead, Waiting For the Right Price 💸
Fair Value US$204.74|9.5% overvalued
FR
Community Contributor
Good foundation, but now it's all about the next steps
Fair Value US$147.87|27.6% undervalued
TO
Community Contributor
XTB's Path to 100–120 PLN by 2028 Amid Market Volatility
Fair Value zł100.96|36.6% undervalued
DZ
Community Contributor