Will Weakness in Ryohin Keikaku Co., Ltd.'s (TSE:7453) Stock Prove Temporary Given Strong Fundamentals?

It is hard to get excited after looking at Ryohin Keikaku's (TSE:7453) recent performance, when its stock has declined 6.3% over the past month. However, stock prices are usually driven by a company’s financial performance over the long term, which in this case looks quite promising. In this article, we decided to focus on Ryohin Keikaku's ROE.
Return on equity or ROE is a key measure used to assess how efficiently a company's management is utilizing the company's capital. In short, ROE shows the profit each dollar generates with respect to its shareholder investments.
Check out our latest analysis for Ryohin Keikaku
How Do You Calculate Return On Equity?
The formula for ROE is:
Return on Equity = Net Profit (from continuing operations) ÷ Shareholders' Equity
So, based on the above formula, the ROE for Ryohin Keikaku is:
12% = JP¥37b ÷ JP¥315b (Based on the trailing twelve months to May 2024).
The 'return' is the yearly profit. One way to conceptualize this is that for each ¥1 of shareholders' capital it has, the company made ¥0.12 in profit.
What Has ROE Got To Do With Earnings Growth?
We have already established that ROE serves as an efficient profit-generating gauge for a company's future earnings. Based on how much of its profits the company chooses to reinvest or "retain", we are then able to evaluate a company's future ability to generate profits. Generally speaking, other things being equal, firms with a high return on equity and profit retention, have a higher growth rate than firms that don’t share these attributes.
A Side By Side comparison of Ryohin Keikaku's Earnings Growth And 12% ROE
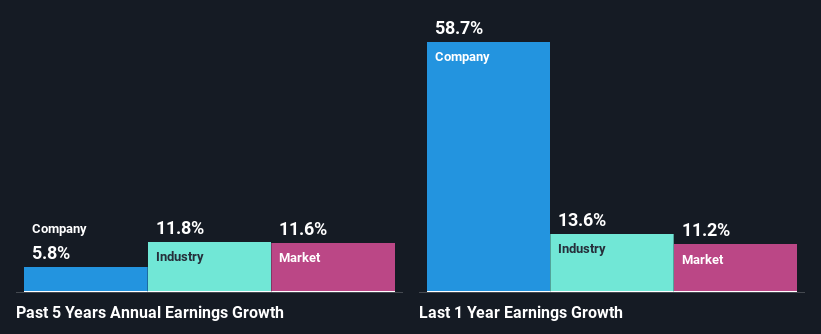
At first glance, Ryohin Keikaku seems to have a decent ROE. And on comparing with the industry, we found that the the average industry ROE is similar at 10%. This probably goes some way in explaining Ryohin Keikaku's moderate 5.8% growth over the past five years amongst other factors.
Next, on comparing with the industry net income growth, we found that Ryohin Keikaku's reported growth was lower than the industry growth of 12% over the last few years, which is not something we like to see.
Earnings growth is an important metric to consider when valuing a stock. What investors need to determine next is if the expected earnings growth, or the lack of it, is already built into the share price. By doing so, they will have an idea if the stock is headed into clear blue waters or if swampy waters await. What is 7453 worth today? The intrinsic value infographic in our free research report helps visualize whether 7453 is currently mispriced by the market.
Is Ryohin Keikaku Efficiently Re-investing Its Profits?
With a three-year median payout ratio of 35% (implying that the company retains 65% of its profits), it seems that Ryohin Keikaku is reinvesting efficiently in a way that it sees respectable amount growth in its earnings and pays a dividend that's well covered.
Additionally, Ryohin Keikaku has paid dividends over a period of at least ten years which means that the company is pretty serious about sharing its profits with shareholders.
Summary
Overall, we are quite pleased with Ryohin Keikaku's performance. Specifically, we like that the company is reinvesting a huge chunk of its profits at a high rate of return. This of course has caused the company to see a good amount of growth in its earnings. On studying current analyst estimates, we found that analysts expect the company to continue its recent growth streak. Are these analysts expectations based on the broad expectations for the industry, or on the company's fundamentals? Click here to be taken to our analyst's forecasts page for the company.
New: AI Stock Screener & Alerts
Our new AI Stock Screener scans the market every day to uncover opportunities.
• Dividend Powerhouses (3%+ Yield)
• Undervalued Small Caps with Insider Buying
• High growth Tech and AI Companies
Or build your own from over 50 metrics.
Have feedback on this article? Concerned about the content? Get in touch with us directly. Alternatively, email editorial-team (at) simplywallst.com.
This article by Simply Wall St is general in nature. We provide commentary based on historical data and analyst forecasts only using an unbiased methodology and our articles are not intended to be financial advice. It does not constitute a recommendation to buy or sell any stock, and does not take account of your objectives, or your financial situation. We aim to bring you long-term focused analysis driven by fundamental data. Note that our analysis may not factor in the latest price-sensitive company announcements or qualitative material. Simply Wall St has no position in any stocks mentioned.
About TSE:7453
Ryohin Keikaku
Develops, manufactures, distributes, and sells apparel, household goods, and food items in Japan and internationally.
Solid track record with excellent balance sheet.

