Can Do Co., Ltd. (TSE:2698) Stock Rockets 25% As Investors Are Less Pessimistic Than Expected


Despite an already strong run, Can Do Co., Ltd. (TSE:2698) shares have been powering on, with a gain of 25% in the last thirty days. The last 30 days bring the annual gain to a very sharp 58%.
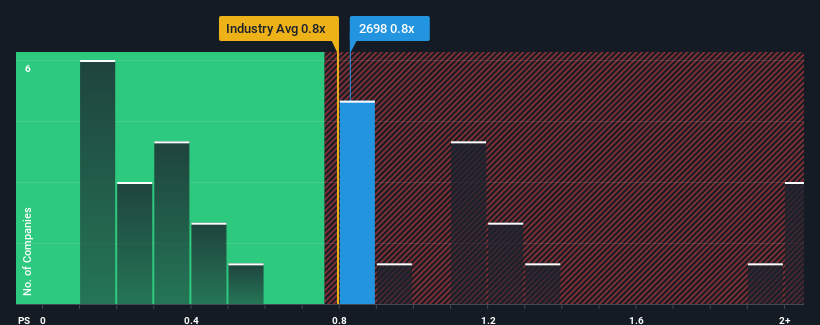
In spite of the firm bounce in price, it's still not a stretch to say that Can Do's price-to-sales (or "P/S") ratio of 0.8x right now seems quite "middle-of-the-road" compared to the Multiline Retail industry in Japan, seeing as it matches the P/S ratio of the wider industry. Although, it's not wise to simply ignore the P/S without explanation as investors may be disregarding a distinct opportunity or a costly mistake.
View our latest analysis for Can Do
How Has Can Do Performed Recently?
Can Do has been doing a decent job lately as it's been growing revenue at a reasonable pace. One possibility is that the P/S is moderate because investors think this good revenue growth might only be parallel to the broader industry in the near future. If not, then at least existing shareholders probably aren't too pessimistic about the future direction of the share price.
Although there are no analyst estimates available for Can Do, take a look at this free data-rich visualisation to see how the company stacks up on earnings, revenue and cash flow.Do Revenue Forecasts Match The P/S Ratio?
Can Do's P/S ratio would be typical for a company that's only expected to deliver moderate growth, and importantly, perform in line with the industry.
Retrospectively, the last year delivered a decent 6.5% gain to the company's revenues. The latest three year period has also seen a 11% overall rise in revenue, aided somewhat by its short-term performance. Therefore, it's fair to say the revenue growth recently has been respectable for the company.
Comparing that to the industry, which is predicted to deliver 7.4% growth in the next 12 months, the company's momentum is weaker, based on recent medium-term annualised revenue results.
With this in mind, we find it intriguing that Can Do's P/S is comparable to that of its industry peers. Apparently many investors in the company are less bearish than recent times would indicate and aren't willing to let go of their stock right now. They may be setting themselves up for future disappointment if the P/S falls to levels more in line with recent growth rates.
The Bottom Line On Can Do's P/S
Its shares have lifted substantially and now Can Do's P/S is back within range of the industry median. We'd say the price-to-sales ratio's power isn't primarily as a valuation instrument but rather to gauge current investor sentiment and future expectations.
Our examination of Can Do revealed its poor three-year revenue trends aren't resulting in a lower P/S as per our expectations, given they look worse than current industry outlook. When we see weak revenue with slower than industry growth, we suspect the share price is at risk of declining, bringing the P/S back in line with expectations. Unless there is a significant improvement in the company's medium-term performance, it will be difficult to prevent the P/S ratio from declining to a more reasonable level.
It's always necessary to consider the ever-present spectre of investment risk. We've identified 1 warning sign with Can Do, and understanding should be part of your investment process.
If strong companies turning a profit tickle your fancy, then you'll want to check out this free list of interesting companies that trade on a low P/E (but have proven they can grow earnings).
New: AI Stock Screener & Alerts
Our new AI Stock Screener scans the market every day to uncover opportunities.
• Dividend Powerhouses (3%+ Yield)
• Undervalued Small Caps with Insider Buying
• High growth Tech and AI Companies
Or build your own from over 50 metrics.
Have feedback on this article? Concerned about the content? Get in touch with us directly. Alternatively, email editorial-team (at) simplywallst.com.
This article by Simply Wall St is general in nature. We provide commentary based on historical data and analyst forecasts only using an unbiased methodology and our articles are not intended to be financial advice. It does not constitute a recommendation to buy or sell any stock, and does not take account of your objectives, or your financial situation. We aim to bring you long-term focused analysis driven by fundamental data. Note that our analysis may not factor in the latest price-sensitive company announcements or qualitative material. Simply Wall St has no position in any stocks mentioned.
Have feedback on this article? Concerned about the content? Get in touch with us directly. Alternatively, email editorial-team@simplywallst.com
About TSE:2698
Excellent balance sheet and slightly overvalued.
