
Advertisement
Aeon Kyushu's (TSE:2653) Earnings Seem To Be Promising
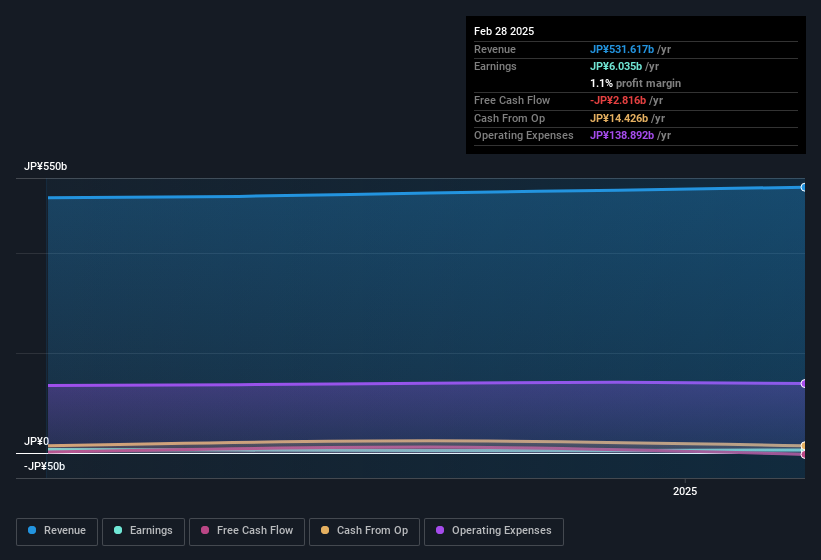
Aeon Kyushu Co., Ltd.'s (TSE:2653) recent earnings report didn't offer any surprises, with the shares unchanged over the last week. Our analysis suggests that shareholders might be missing some positive underlying factors in the earnings report.
A Closer Look At Aeon Kyushu's Earnings
As finance nerds would already know, the accrual ratio from cashflow is a key measure for assessing how well a company's free cash flow (FCF) matches its profit. In plain english, this ratio subtracts FCF from net profit, and divides that number by the company's average operating assets over that period. The ratio shows us how much a company's profit exceeds its FCF.
As a result, a negative accrual ratio is a positive for the company, and a positive accrual ratio is a negative. While it's not a problem to have a positive accrual ratio, indicating a certain level of non-cash profits, a high accrual ratio is arguably a bad thing, because it indicates paper profits are not matched by cash flow. To quote a 2014 paper by Lewellen and Resutek, "firms with higher accruals tend to be less profitable in the future".
For the year to February 2025, Aeon Kyushu had an accrual ratio of 0.20. Therefore, we know that it's free cashflow was significantly lower than its statutory profit, which is hardly a good thing. In the last twelve months it actually had negative free cash flow, with an outflow of JP¥2.8b despite its profit of JP¥6.04b, mentioned above. As it happens we don't have the data on what Aeon Kyushu produced by way of free cashflow, the year before, which is a pity. Having said that, there is more to the story. The accrual ratio is reflecting the impact of unusual items on statutory profit, at least in part.
View our latest analysis for Aeon Kyushu
Note: we always recommend investors check balance sheet strength. Click here to be taken to our balance sheet analysis of Aeon Kyushu.
How Do Unusual Items Influence Profit?
Unfortunately (in the short term) Aeon Kyushu saw its profit reduced by unusual items worth JP¥2.3b. If this was a non-cash charge, it would have made the accrual ratio better, if cashflow had stayed strong, so it's not great to see in combination with an uninspiring accrual ratio. It's never great to see unusual items costing the company profits, but on the upside, things might improve sooner rather than later. We looked at thousands of listed companies and found that unusual items are very often one-off in nature. And that's hardly a surprise given these line items are considered unusual. If Aeon Kyushu doesn't see those unusual expenses repeat, then all else being equal we'd expect its profit to increase over the coming year.
Our Take On Aeon Kyushu's Profit Performance
Aeon Kyushu saw unusual items weigh on its profit, which should have made it easier to show high cash conversion, which it did not do, according to its accrual ratio. Considering the aforementioned, we think that Aeon Kyushu's profits are probably a reasonable reflection of its underlying profitability; although we'd be confident in that conclusion if we saw a cleaner set of results. Keep in mind, when it comes to analysing a stock it's worth noting the risks involved. Our analysis shows 3 warning signs for Aeon Kyushu (1 is concerning!) and we strongly recommend you look at these before investing.
Our examination of Aeon Kyushu has focussed on certain factors that can make its earnings look better than they are. But there are plenty of other ways to inform your opinion of a company. Some people consider a high return on equity to be a good sign of a quality business. So you may wish to see this free collection of companies boasting high return on equity, or this list of stocks with high insider ownership.
New: Manage All Your Stock Portfolios in One Place
We've created the ultimate portfolio companion for stock investors, and it's free.
• Connect an unlimited number of Portfolios and see your total in one currency
• Be alerted to new Warning Signs or Risks via email or mobile
• Track the Fair Value of your stocks
Have feedback on this article? Concerned about the content? Get in touch with us directly. Alternatively, email editorial-team (at) simplywallst.com.
This article by Simply Wall St is general in nature. We provide commentary based on historical data and analyst forecasts only using an unbiased methodology and our articles are not intended to be financial advice. It does not constitute a recommendation to buy or sell any stock, and does not take account of your objectives, or your financial situation. We aim to bring you long-term focused analysis driven by fundamental data. Note that our analysis may not factor in the latest price-sensitive company announcements or qualitative material. Simply Wall St has no position in any stocks mentioned.
About TSE:2653
Aeon Kyushu
A retail company, engages in the management of various stores in Japan.
Good value with slight risk.
Market Insights


Advertisement
Community Narratives
America Wants Homegrown Drones — Draganfly Is Ready to Deliver
Fair Value US$9.21|27.4% undervalued
JO
Community Contributor
Cheesecake Factory offers an enticing opportunity for long-term growth by leveraging new concepts
Fair Value US$73.83|25.8% undervalued
ZW
Community Contributor
Coca-Cola’s Intrinsic Value Set to Rise with Fed Rate Cut
Fair Value US$67.50|2.7% undervalued
AL
Community Contributor
Fully Permitted Gold Mine with 50 Baggers Potential 
Fair Value CA$41.00|98.0% undervalued
RO
Community Contributor