
Advertisement
- Japan
- /
- Real Estate
- /
- TSE:8912
Can Mixed Fundamentals Have A Negative Impact on Area Quest Inc. (TSE:8912) Current Share Price Momentum?
Most readers would already be aware that Area Quest's (TSE:8912) stock increased significantly by 30% over the past week. However, we wonder if the company's inconsistent financials would have any adverse impact on the current share price momentum. In this article, we decided to focus on Area Quest's ROE.
Return on equity or ROE is a key measure used to assess how efficiently a company's management is utilizing the company's capital. In short, ROE shows the profit each dollar generates with respect to its shareholder investments.
How Is ROE Calculated?
Return on equity can be calculated by using the formula:
Return on Equity = Net Profit (from continuing operations) ÷ Shareholders' Equity
So, based on the above formula, the ROE for Area Quest is:
8.1% = JP¥112m ÷ JP¥1.4b (Based on the trailing twelve months to June 2025).
The 'return' is the income the business earned over the last year. So, this means that for every ¥1 of its shareholder's investments, the company generates a profit of ¥0.08.
See our latest analysis for Area Quest
What Is The Relationship Between ROE And Earnings Growth?
So far, we've learned that ROE is a measure of a company's profitability. Depending on how much of these profits the company reinvests or "retains", and how effectively it does so, we are then able to assess a company’s earnings growth potential. Assuming everything else remains unchanged, the higher the ROE and profit retention, the higher the growth rate of a company compared to companies that don't necessarily bear these characteristics.
A Side By Side comparison of Area Quest's Earnings Growth And 8.1% ROE
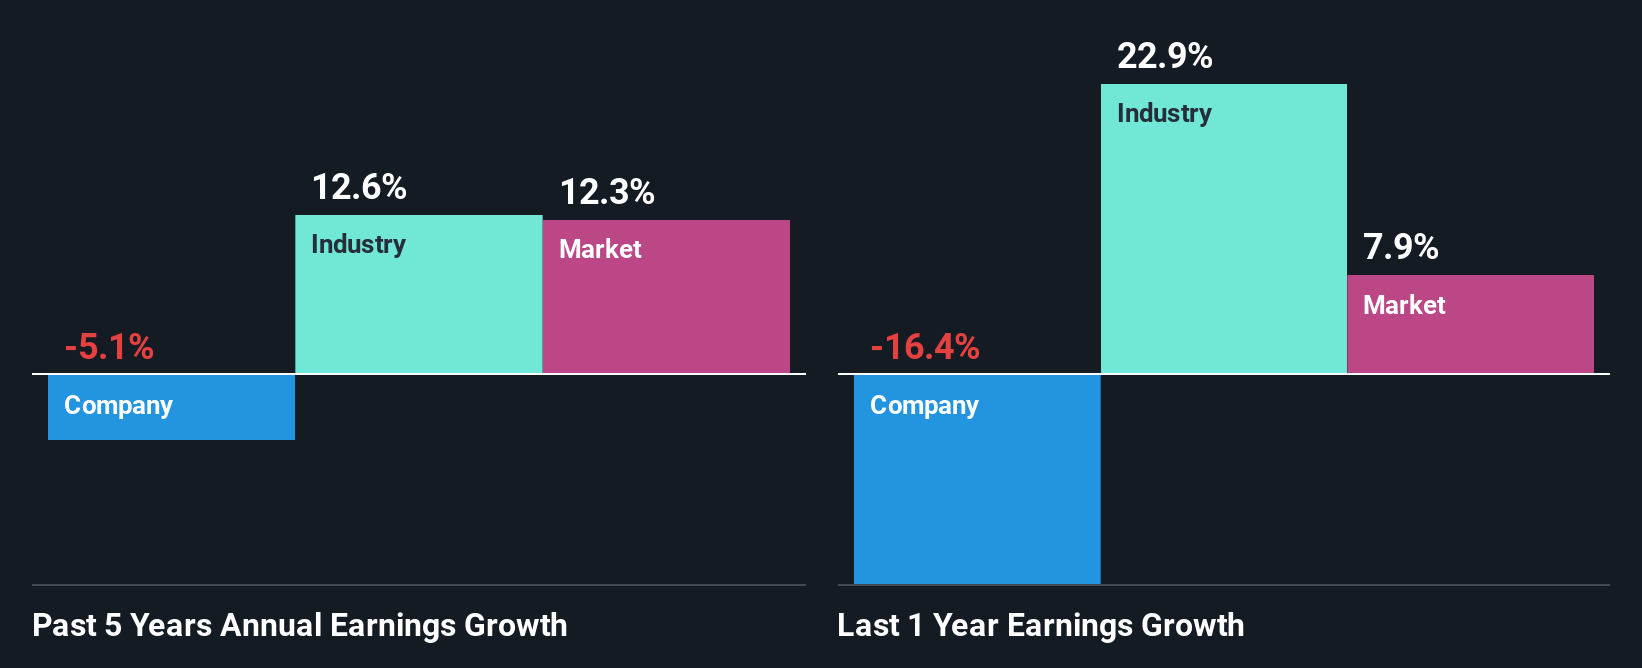
At first glance, Area Quest's ROE doesn't look very promising. Next, when compared to the average industry ROE of 12%, the company's ROE leaves us feeling even less enthusiastic. Given the circumstances, the significant decline in net income by 5.1% seen by Area Quest over the last five years is not surprising. We believe that there also might be other aspects that are negatively influencing the company's earnings prospects. Such as - low earnings retention or poor allocation of capital.
However, when we compared Area Quest's growth with the industry we found that while the company's earnings have been shrinking, the industry has seen an earnings growth of 13% in the same period. This is quite worrisome.
Earnings growth is a huge factor in stock valuation. What investors need to determine next is if the expected earnings growth, or the lack of it, is already built into the share price. This then helps them determine if the stock is placed for a bright or bleak future. One good indicator of expected earnings growth is the P/E ratio which determines the price the market is willing to pay for a stock based on its earnings prospects. So, you may want to check if Area Quest is trading on a high P/E or a low P/E, relative to its industry.
Is Area Quest Using Its Retained Earnings Effectively?
Despite having a normal three-year median payout ratio of 38% (where it is retaining 62% of its profits), Area Quest has seen a decline in earnings as we saw above. So there could be some other explanations in that regard. For instance, the company's business may be deteriorating.
Additionally, Area Quest has paid dividends over a period of at least ten years, which means that the company's management is determined to pay dividends even if it means little to no earnings growth.
Conclusion
In total, we're a bit ambivalent about Area Quest's performance. While the company does have a high rate of profit retention, its low rate of return is probably hampering its earnings growth. Wrapping up, we would proceed with caution with this company and one way of doing that would be to look at the risk profile of the business. Our risks dashboard would have the 4 risks we have identified for Area Quest.
New: Manage All Your Stock Portfolios in One Place
We've created the ultimate portfolio companion for stock investors, and it's free.
• Connect an unlimited number of Portfolios and see your total in one currency
• Be alerted to new Warning Signs or Risks via email or mobile
• Track the Fair Value of your stocks
Have feedback on this article? Concerned about the content? Get in touch with us directly. Alternatively, email editorial-team (at) simplywallst.com.
This article by Simply Wall St is general in nature. We provide commentary based on historical data and analyst forecasts only using an unbiased methodology and our articles are not intended to be financial advice. It does not constitute a recommendation to buy or sell any stock, and does not take account of your objectives, or your financial situation. We aim to bring you long-term focused analysis driven by fundamental data. Note that our analysis may not factor in the latest price-sensitive company announcements or qualitative material. Simply Wall St has no position in any stocks mentioned.
About TSE:8912
Adequate balance sheet with slight risk.
Market Insights

Advertisement
Community Narratives
A formidable player in AI and enterprise computing.
Fair Value US$210.00|12.2% overvalued
CO
Community Contributor
IREN's Bold Moves in Sustainable Bitcoin Mining & AI Data Centers
Fair Value US$72.52|17.1% undervalued
BL
Community Contributor
Cooling the Champions: The Aussie Tech Behind F1's Victories
Fair Value AU$12.40|38.7% undervalued
TR
Community Contributor