- Japan
- /
- Real Estate
- /
- TSE:8830
These 4 Measures Indicate That Sumitomo Realty & Development (TSE:8830) Is Using Debt Extensively

The external fund manager backed by Berkshire Hathaway's Charlie Munger, Li Lu, makes no bones about it when he says 'The biggest investment risk is not the volatility of prices, but whether you will suffer a permanent loss of capital.' So it seems the smart money knows that debt - which is usually involved in bankruptcies - is a very important factor, when you assess how risky a company is. As with many other companies Sumitomo Realty & Development Co., Ltd. (TSE:8830) makes use of debt. But the more important question is: how much risk is that debt creating?
When Is Debt A Problem?
Generally speaking, debt only becomes a real problem when a company can't easily pay it off, either by raising capital or with its own cash flow. If things get really bad, the lenders can take control of the business. However, a more common (but still painful) scenario is that it has to raise new equity capital at a low price, thus permanently diluting shareholders. Of course, debt can be an important tool in businesses, particularly capital heavy businesses. The first step when considering a company's debt levels is to consider its cash and debt together.
View our latest analysis for Sumitomo Realty & Development
What Is Sumitomo Realty & Development's Debt?
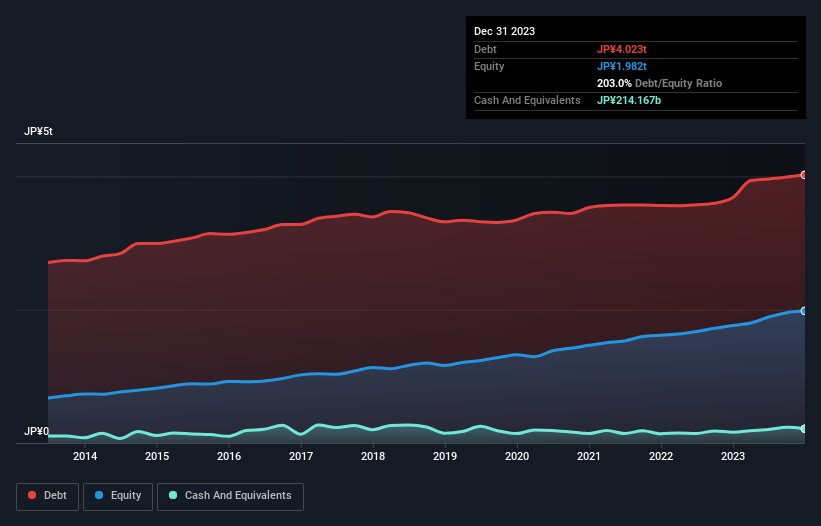
The image below, which you can click on for greater detail, shows that at December 2023 Sumitomo Realty & Development had debt of JP¥4.02t, up from JP¥3.68t in one year. However, because it has a cash reserve of JP¥214.2b, its net debt is less, at about JP¥3.81t.
How Strong Is Sumitomo Realty & Development's Balance Sheet?
We can see from the most recent balance sheet that Sumitomo Realty & Development had liabilities of JP¥951.6b falling due within a year, and liabilities of JP¥3.65t due beyond that. Offsetting these obligations, it had cash of JP¥214.2b as well as receivables valued at JP¥20.9b due within 12 months. So it has liabilities totalling JP¥4.37t more than its cash and near-term receivables, combined.
The deficiency here weighs heavily on the JP¥2.81t company itself, as if a child were struggling under the weight of an enormous back-pack full of books, his sports gear, and a trumpet. So we'd watch its balance sheet closely, without a doubt. At the end of the day, Sumitomo Realty & Development would probably need a major re-capitalization if its creditors were to demand repayment.
We use two main ratios to inform us about debt levels relative to earnings. The first is net debt divided by earnings before interest, tax, depreciation, and amortization (EBITDA), while the second is how many times its earnings before interest and tax (EBIT) covers its interest expense (or its interest cover, for short). This way, we consider both the absolute quantum of the debt, as well as the interest rates paid on it.
As it happens Sumitomo Realty & Development has a fairly concerning net debt to EBITDA ratio of 12.1 but very strong interest coverage of 1k. This means that unless the company has access to very cheap debt, that interest expense will likely grow in the future. We saw Sumitomo Realty & Development grow its EBIT by 4.8% in the last twelve months. Whilst that hardly knocks our socks off it is a positive when it comes to debt. There's no doubt that we learn most about debt from the balance sheet. But it is future earnings, more than anything, that will determine Sumitomo Realty & Development's ability to maintain a healthy balance sheet going forward. So if you want to see what the professionals think, you might find this free report on analyst profit forecasts to be interesting.
Finally, while the tax-man may adore accounting profits, lenders only accept cold hard cash. So we always check how much of that EBIT is translated into free cash flow. Over the last three years, Sumitomo Realty & Development saw substantial negative free cash flow, in total. While investors are no doubt expecting a reversal of that situation in due course, it clearly does mean its use of debt is more risky.
Our View
On the face of it, Sumitomo Realty & Development's net debt to EBITDA left us tentative about the stock, and its conversion of EBIT to free cash flow was no more enticing than the one empty restaurant on the busiest night of the year. But on the bright side, its interest cover is a good sign, and makes us more optimistic. Overall, it seems to us that Sumitomo Realty & Development's balance sheet is really quite a risk to the business. So we're almost as wary of this stock as a hungry kitten is about falling into its owner's fish pond: once bitten, twice shy, as they say. The balance sheet is clearly the area to focus on when you are analysing debt. But ultimately, every company can contain risks that exist outside of the balance sheet. For example - Sumitomo Realty & Development has 1 warning sign we think you should be aware of.
If you're interested in investing in businesses that can grow profits without the burden of debt, then check out this free list of growing businesses that have net cash on the balance sheet.
New: Manage All Your Stock Portfolios in One Place
We've created the ultimate portfolio companion for stock investors, and it's free.
• Connect an unlimited number of Portfolios and see your total in one currency
• Be alerted to new Warning Signs or Risks via email or mobile
• Track the Fair Value of your stocks
Have feedback on this article? Concerned about the content? Get in touch with us directly. Alternatively, email editorial-team (at) simplywallst.com.
This article by Simply Wall St is general in nature. We provide commentary based on historical data and analyst forecasts only using an unbiased methodology and our articles are not intended to be financial advice. It does not constitute a recommendation to buy or sell any stock, and does not take account of your objectives, or your financial situation. We aim to bring you long-term focused analysis driven by fundamental data. Note that our analysis may not factor in the latest price-sensitive company announcements or qualitative material. Simply Wall St has no position in any stocks mentioned.
About TSE:8830
Sumitomo Realty & Development
Engages in the real estate business in Japan.
Acceptable track record with mediocre balance sheet.
Similar Companies
Market Insights

Community Narratives
