We Think Kringle Pharma (TSE:4884) Can Afford To Drive Business Growth


There's no doubt that money can be made by owning shares of unprofitable businesses. For example, although Amazon.com made losses for many years after listing, if you had bought and held the shares since 1999, you would have made a fortune. Having said that, unprofitable companies are risky because they could potentially burn through all their cash and become distressed.
So, the natural question for Kringle Pharma (TSE:4884) shareholders is whether they should be concerned by its rate of cash burn. For the purposes of this article, cash burn is the annual rate at which an unprofitable company spends cash to fund its growth; its negative free cash flow. The first step is to compare its cash burn with its cash reserves, to give us its 'cash runway'.
See our latest analysis for Kringle Pharma
How Long Is Kringle Pharma's Cash Runway?
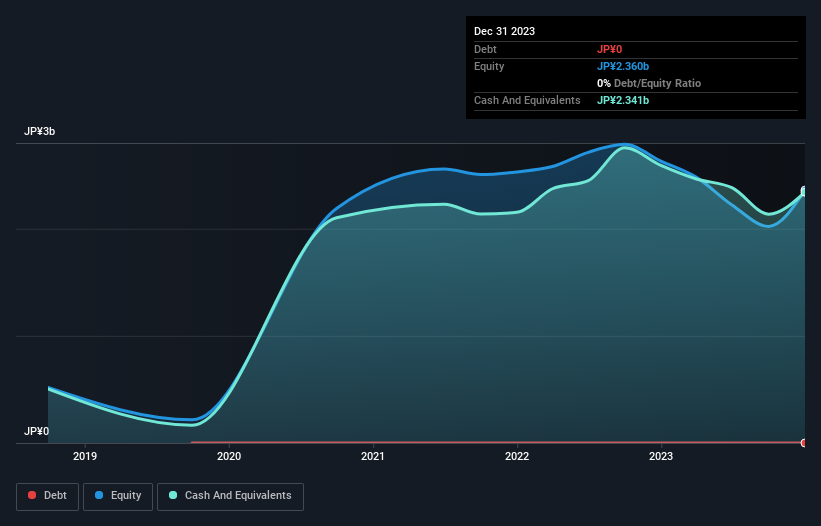
You can calculate a company's cash runway by dividing the amount of cash it has by the rate at which it is spending that cash. As at December 2023, Kringle Pharma had cash of JP¥2.3b and no debt. Looking at the last year, the company burnt through JP¥689m. So it had a cash runway of about 3.4 years from December 2023. There's no doubt that this is a reassuringly long runway. You can see how its cash balance has changed over time in the image below.
How Is Kringle Pharma's Cash Burn Changing Over Time?
Whilst it's great to see that Kringle Pharma has already begun generating revenue from operations, last year it only produced JP¥70m, so we don't think it is generating significant revenue, at this point. As a result, we think it's a bit early to focus on the revenue growth, so we'll limit ourselves to looking at how the cash burn is changing over time. Remarkably, it actually increased its cash burn by 1,092% in the last year. With that kind of spending growth its cash runway will shorten quickly, as it simultaneously uses its cash while increasing the burn rate. Admittedly, we're a bit cautious of Kringle Pharma due to its lack of significant operating revenues. We prefer most of the stocks on this list of stocks that analysts expect to grow.
How Hard Would It Be For Kringle Pharma To Raise More Cash For Growth?
While Kringle Pharma does have a solid cash runway, its cash burn trajectory may have some shareholders thinking ahead to when the company may need to raise more cash. Issuing new shares, or taking on debt, are the most common ways for a listed company to raise more money for its business. Many companies end up issuing new shares to fund future growth. By comparing a company's annual cash burn to its total market capitalisation, we can estimate roughly how many shares it would have to issue in order to run the company for another year (at the same burn rate).
Kringle Pharma has a market capitalisation of JP¥3.1b and burnt through JP¥689m last year, which is 22% of the company's market value. That's not insignificant, and if the company had to sell enough shares to fund another year's growth at the current share price, you'd likely witness fairly costly dilution.
So, Should We Worry About Kringle Pharma's Cash Burn?
On this analysis of Kringle Pharma's cash burn, we think its cash runway was reassuring, while its increasing cash burn has us a bit worried. While we're the kind of investors who are always a bit concerned about the risks involved with cash burning companies, the metrics we have discussed in this article leave us relatively comfortable about Kringle Pharma's situation. On another note, Kringle Pharma has 5 warning signs (and 3 which can't be ignored) we think you should know about.
Of course Kringle Pharma may not be the best stock to buy. So you may wish to see this free collection of companies boasting high return on equity, or this list of stocks that insiders are buying.
Valuation is complex, but we're here to simplify it.
Discover if Kringle Pharma might be undervalued or overvalued with our detailed analysis, featuring fair value estimates, potential risks, dividends, insider trades, and its financial condition.
Access Free AnalysisHave feedback on this article? Concerned about the content? Get in touch with us directly. Alternatively, email editorial-team (at) simplywallst.com.
This article by Simply Wall St is general in nature. We provide commentary based on historical data and analyst forecasts only using an unbiased methodology and our articles are not intended to be financial advice. It does not constitute a recommendation to buy or sell any stock, and does not take account of your objectives, or your financial situation. We aim to bring you long-term focused analysis driven by fundamental data. Note that our analysis may not factor in the latest price-sensitive company announcements or qualitative material. Simply Wall St has no position in any stocks mentioned.
About TSE:4884
Kringle Pharma
Engages in the research and development, manufactures, and sells hepatocyte growth factor (HGF) protein pharmaceuticals for regenerative medicines.
Flawless balance sheet slight.
Market Insights

Community Narratives


